
On this page
Theory of Consumer Behaviour is Chapter 2 of NCERT's Introductory Microeconomics, reprint 2026-27. It asks which bundle a consumer chooses with a fixed income at given prices. This guide maps the chapter and works one connecting example.
What does the 2026-27 syllabus include for this chapter?
The CBSE Economics curriculum for 2026-27 places the chapter in Unit 5, Consumer's Equilibrium and Demand, which carries 14 marks in the 80-mark Class XI theory paper. It lists three blocks:
Utility analysis: marginal utility, its diminishing law, and equilibrium using marginal utility.
Indifference curve analysis: budget set and line, indifference map, and equilibrium conditions.
Demand: determinants, the demand curve, movement versus shift, market demand, and price elasticity by the percentage-change and total expenditure methods.
The NCERT chapter also shows a geometric elasticity method that the curriculum does not name. CBSE's academic website lists sample papers for Classes X and XII only, so for Class 11 follow the curriculum's question mix: 40% remembering and understanding, 30% applying, and 30% analysing, evaluating and creating.
How do the topics in the chapter connect?
Read the NCERT chapter as a chain of four steps.
Preferences. Cardinal analysis measures utility, and MUn = TUn − TUn−1 falls as you consume more. Ordinal analysis only ranks bundles on indifference curves, whose absolute slope, the marginal rate of substitution (MRS), diminishes. Our guide to consumer equilibrium with marginal utility works through the MU tables.
What you can afford. The budget line p1x1 + p2x2 = M has slope −p1/p2. A change in income shifts it parallel; a change in one price pivots it.
The choice. The optimum is where the budget line is tangent to the highest indifference curve it can reach, so MRS = p1/p2. See indifference curves, the budget line and the tangency point.
Demand. Change p1, find each new optimum, and plot price against quantity. Elasticity then measures the response; see our price elasticity of demand guide with a worked numerical.
Worked example: how do you derive a demand curve from indifference curves?
NCERT section 2.4.2 derives demand from indifference curves and budget lines. Here it is with our own numbers.
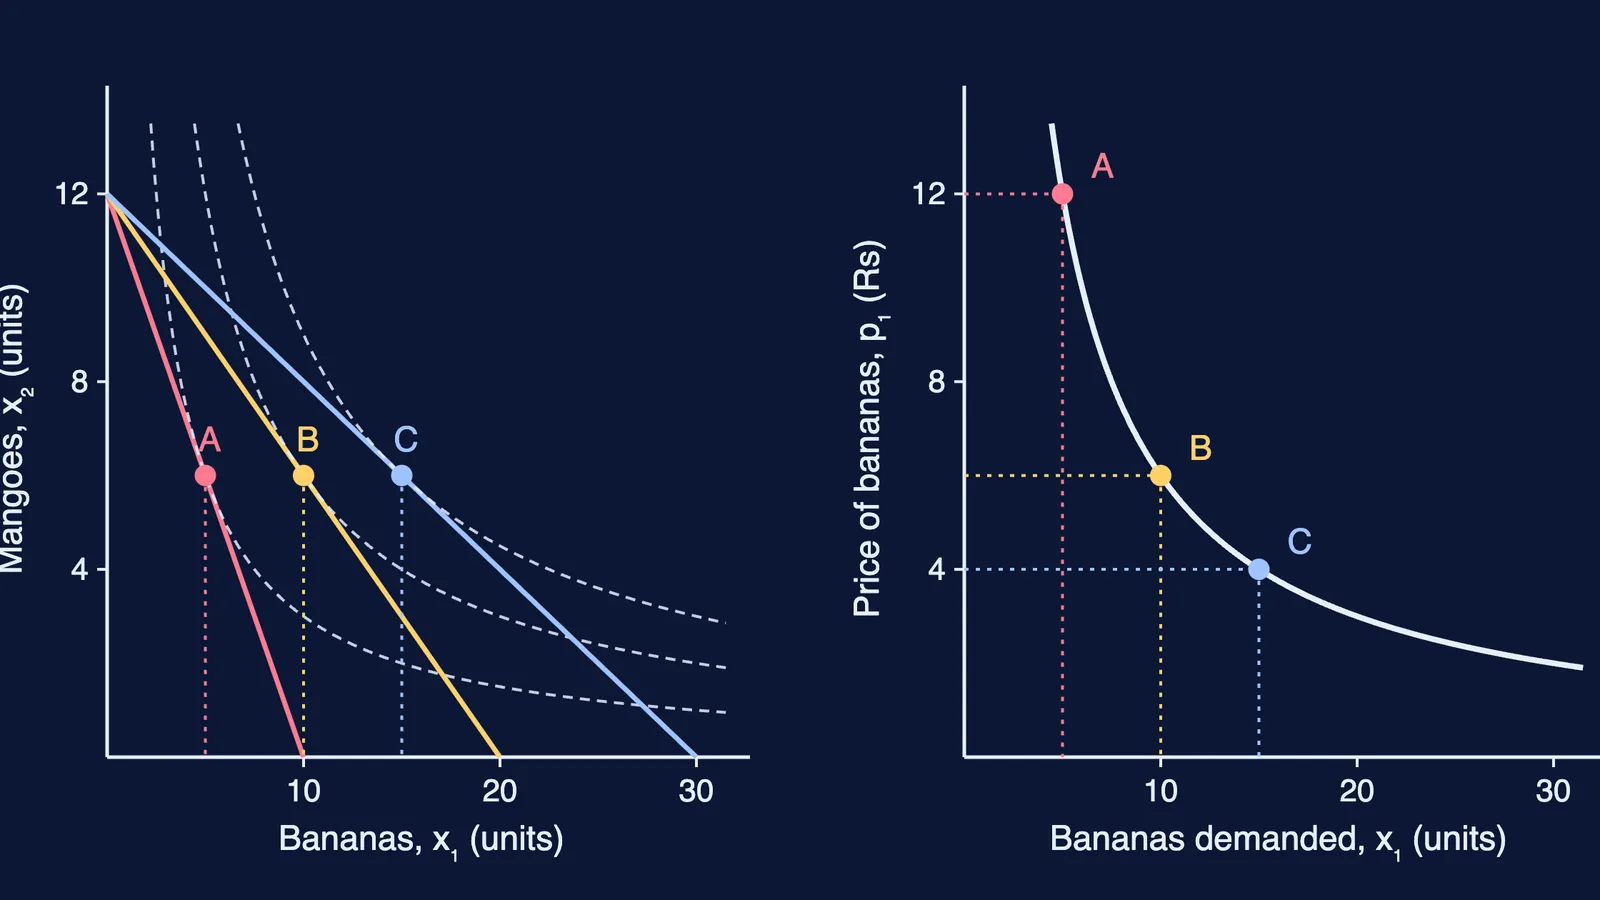
Riya has M = Rs 120 to spend on bananas (x1) and mangoes (x2, at p2 = Rs 10). Her indifference curves are x1 × x2 = constant, so MRS = x2/x1.
p1 = Rs 12. MRS = p1/p2 gives x2 = 1.2x1. Budget: 12x1 + 10(1.2x1) = 120, so 24x1 = 120, x1 = 5 and x2 = 6. Check: 60 + 60 = 120. This is point A.
p1 falls to Rs 6. x2 = 0.6x1, so 6x1 + 6x1 = 120, giving x1 = 10 and x2 = 6 (point B).
p1 falls to Rs 4. x2 = 0.4x1, so 4x1 + 4x1 = 120, giving x1 = 15 and x2 = 6 (point C).
Plot price against quantity: (5, Rs 12), (10, Rs 6), (15, Rs 4). The curve slopes down: the law of demand. Each price cut pivots the budget line outward around its vertical intercept, 12 mangoes.
Elasticity by total expenditure. Spending on bananas is 12 × 5 = 6 × 10 = 4 × 15 = Rs 60 every time. Unchanged expenditure means unitary elastic demand. Demand is x1 = 60/p1, a rectangular hyperbola, which NCERT shows has |eD| = 1 at every point.
Now hold p1 at Rs 6 and raise income to Rs 180: the same method gives x1 = 15 and x2 = 9. She buys more bananas at the same price, so the demand curve shifts right and bananas are a normal good for her. Steps 1 to 3 were movements along one curve.
Which mistakes cost marks in this chapter?
Writing MRS as negative; NCERT uses its absolute value.
Calling an own-price change a shift. It is a movement; income, related prices and tastes cause shifts.
Putting the optimum inside the budget set; with monotonic preferences it is on the line.
Drawing crossing indifference curves.
Adding prices for market demand. Add quantities at each price.
Practice questions (written for this guide; suggested marks)
(1 mark) Bananas cost Rs 8 and mangoes Rs 4. Find the slope of the budget line with bananas on the horizontal axis. Answer: −2.
(3 marks) Why can two indifference curves not intersect?
(4 marks) M = Rs 200, p1 = Rs 10, p2 = Rs 20 and indifference curves of the form x1 × x2 = constant. Find the optimum. Answer: x1 = 10, x2 = 5; MRS = 5/10 = 0.5 = 10/20.
(3 marks) Price rises 10% and spending rises. Is demand elastic? Explain.
(6 marks) Using budget lines and an indifference map, show with a diagram why a fall in a good's price raises the quantity bought.
If one step of the derivation will not click, Fermi's AI tutor can work out what you already know and build a plan for the session.