On this page
In Class 11 Economics, indifference curve analysis is where graphs start making the argument. In the CBSE Economics curriculum for 2025-26, it is part of Unit 5, Consumer's Equilibrium and Demand, which carries 14 of the 40 marks for Introductory Microeconomics. Check the current year's version for marks.
The textbook chapter is Chapter 2, Theory of Consumer Behaviour, in NCERT's Introductory Microeconomics. We use its notation: bananas on the x-axis, mangoes on the y-axis, income M, prices p1 and p2.
What is the budget line in Class 11 economics?
In NCERT's chapter, the budget set is every bundle the consumer can afford: p1x1 + p2x2 ≤ M.
The budget line is the set of bundles that cost exactly M: p1x1 + p2x2 = M.
The line meets the banana axis at M/p1 and the mango axis at M/p2, and its slope is −p1/p2. So one more banana costs p1/p2 mangoes.
Income rises: the line shifts outward, parallel to the old one. Income falls: it shifts inward.
Banana price rises: the line pivots inward around the mango intercept and gets steeper. A price fall makes it flatter.
If slopes and intercepts feel shaky, revise the slope of a line through two points first; the budget line is just y = c + mx. That maths is also in the Fermi Concept Library, which has a lesson for every concept in mathematics.
What are the properties of an indifference curve?
In NCERT's words, an indifference curve joins all the bundles that give the consumer the same satisfaction. A family of these curves is an indifference map. The chapter lists three features:
It slopes downward: to get one more banana and stay equally happy, you give up some mangoes.
A higher curve means more utility: more of one good and no less of the other is always preferred (monotonic preferences).
Two indifference curves never intersect; if they did, the results would contradict each other.
On shape, the curve is usually convex to the origin, because of the diminishing marginal rate of substitution (MRS). For perfect substitutes, such as five-rupee coins and five-rupee notes, the curve is a straight line.
What is the marginal rate of substitution?
The NCERT chapter defines MRS as the amount of mangoes the consumer gives up for one more banana while staying equally satisfied: MRS = |ΔY/ΔX|.
Its table moves from (1 banana, 15 mangoes) to (2, 12), (3, 10) and (4, 9). The mangoes given up fall from 3 to 2 to 1: the law of diminishing MRS, which is why the curve bows toward the origin.
Where is the consumer in equilibrium?
NCERT argues it in two steps. The optimum is on the budget line, because some point on the line always has more of at least one good and no less of the other. And it is where the budget line is tangent to an indifference curve, so MRS = p1/p2. The chapter's check: if MRS is 2 and the prices are equal, the consumer would give 2 mangoes for a banana, but the market asks only 1, so she can do better. A footnote adds that sometimes the optimum is a corner: all income on one good.
Worked example: finding the tangency point
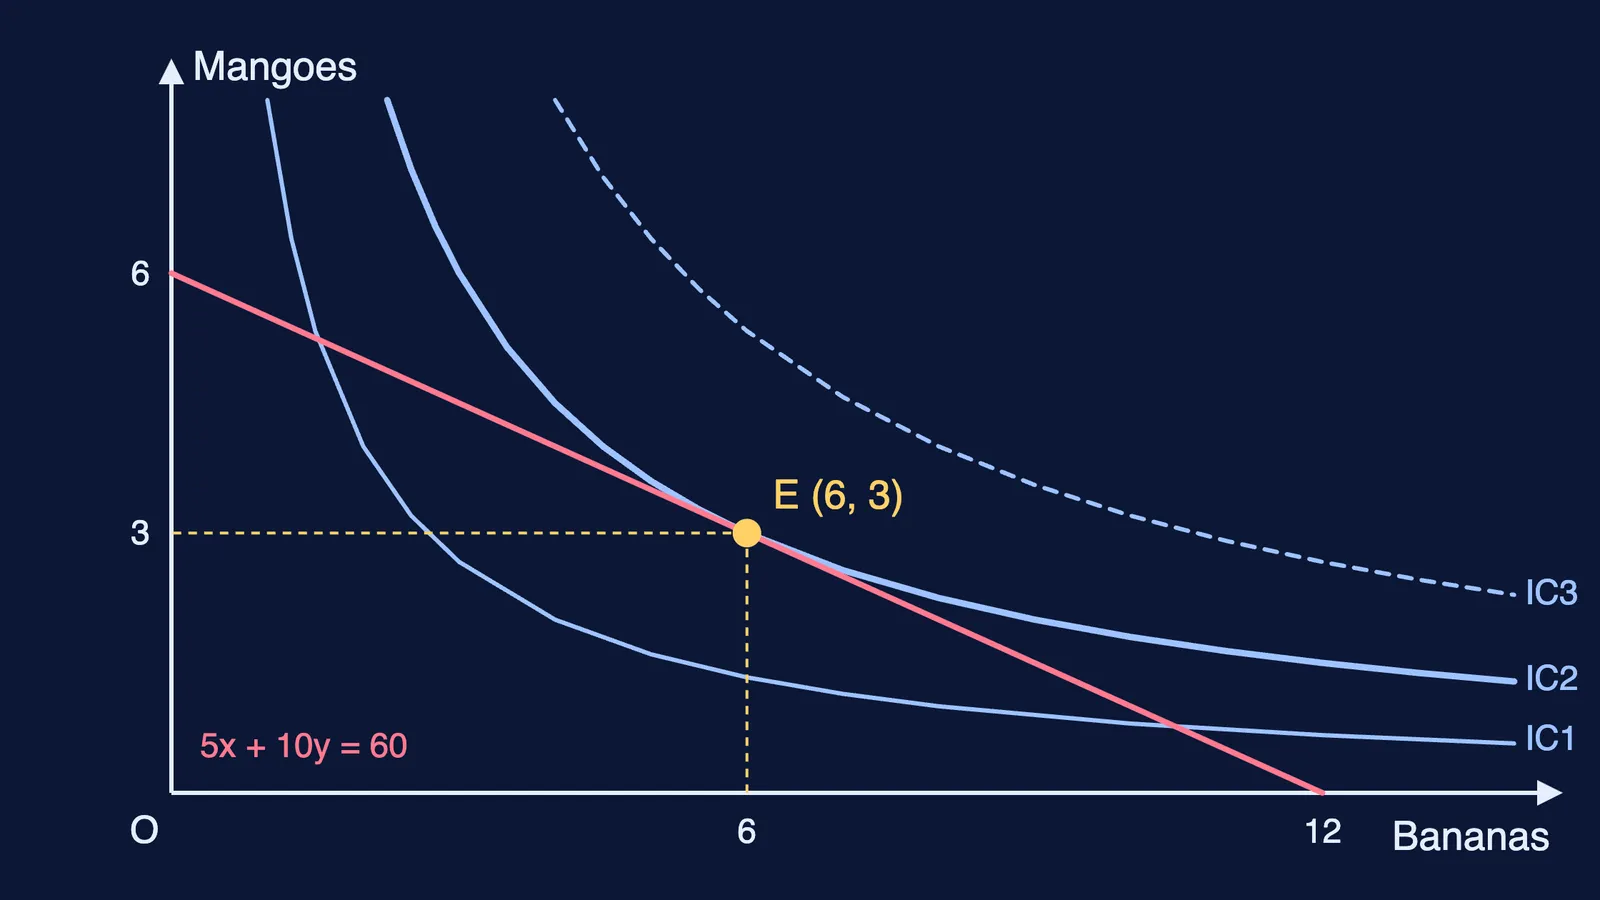
Riya has ₹60. A banana costs ₹5 and a mango costs ₹10. Her budget line is 5x + 10y = 60, with intercepts of 12 bananas and 6 mangoes, and the price ratio is 5/10 = 0.5. Suppose her MRS at any bundle is y/x (what the utility function U = x × y gives).
Test (2, 5). It costs 10 + 50 = ₹60, so it is on the line. MRS = 2.5, more than 0.5: she values a banana at 2.5 mangoes but the market charges 0.5, so she should buy more bananas.
Test (10, 1). Also ₹60. MRS = 0.1, less than 0.5: too many bananas, so move back toward mangoes.
Solve. y/x = 1/2 gives x = 2y. Then 5(2y) + 10y = 60, so y = 3 and x = 6. Check: 30 + 30 = ₹60.
The diagram at the top draws this case: E (6, 3) is on IC2. IC1 cuts the line twice (affordable but worse), and IC3 is out of reach.
A five-step plan for board answers
Draw and label the axes with the two goods.
Mark M/p1 and M/p2, join them, and write the slope as −p1/p2.
Draw three convex indifference curves so that exactly one touches the line.
State the condition MRS = p1/p2 at the point where they touch, and name it E.
Add one line on the unequal case: if MRS is more than p1/p2, buy more of the x-axis good.
A common slip is writing the slope as p2/p1; check it by dividing the vertical intercept by the horizontal one. If you get stuck, Fermi's AI tutor can work out what you already know and build a plan for the session.
Demand curves come next. When an AI tool draws a shift for you, test it with our sketch-first check for demand-supply diagrams.