
On this page
Your economics homework asks what happens to onion prices after a bad harvest, and a chatbot gives you a smooth, confident paragraph. The trouble is that a classic mistake in this chapter, mixing up a shift of a curve with a movement along it, reads perfectly well in words. It only looks wrong once you draw it.
What is the difference between a shift and a movement along the curve?
NCERT's Class 12 Introductory Microeconomics, Chapter 2 states the rule plainly: any change in the price of the good leads to a movement along its demand curve, while a change in any of the other things (the consumer's income, prices of related goods, tastes and preferences) shifts the curve. The same chapter notes that a rise in income shifts the demand curve rightward for normal goods and leftward for inferior goods.
The free OpenStax textbook Principles of Economics 3e agrees: a price change is a change in quantity demanded, a movement along the curve, while a shift means a different quantity is demanded at every price. Supply shifts with weather, input prices and technology.
Why can AI get demand and supply shifts wrong?
OpenStax's four-step process for equilibrium calls it a common mistake "to confuse the shift of a demand or a supply curve with movement along a demand or supply curve". A chatbot writes in fluent sentences, and fluent sentences are exactly where this mistake hides.
A 2025 University of Bristol discussion paper by Natalie Bröse, Christian Spielmann and Christian Tode asked three ChatGPT models to explain 56 introductory economics concepts. Explanations with inaccurate or misleading information in at least an important part made up 28.6% of GPT-3.5 outputs, 17.8% of GPT-4o outputs and 12.5% of o1-preview outputs. Newer models did better, but all presented their answers as fact, and most inaccurate answers could not be caught without research outside the chat. The paper tested general concepts, not demand-supply diagrams, but the warning carries over.
Worked example: what happens when rain damages the onion crop?
The question: unseasonal rain damages the onion crop; explain the effect on the onion market. Here is the kind of answer to watch for (we wrote it to show the pattern; it is not from a particular chatbot):
"The rain reduces supply, so the price of onions rises. Because onions are now costlier, demand for onions falls and the demand curve shifts to the left. The higher price then encourages farmers to supply more, so supply shifts back to the right."
Each sentence sounds reasonable. Now sketch it.
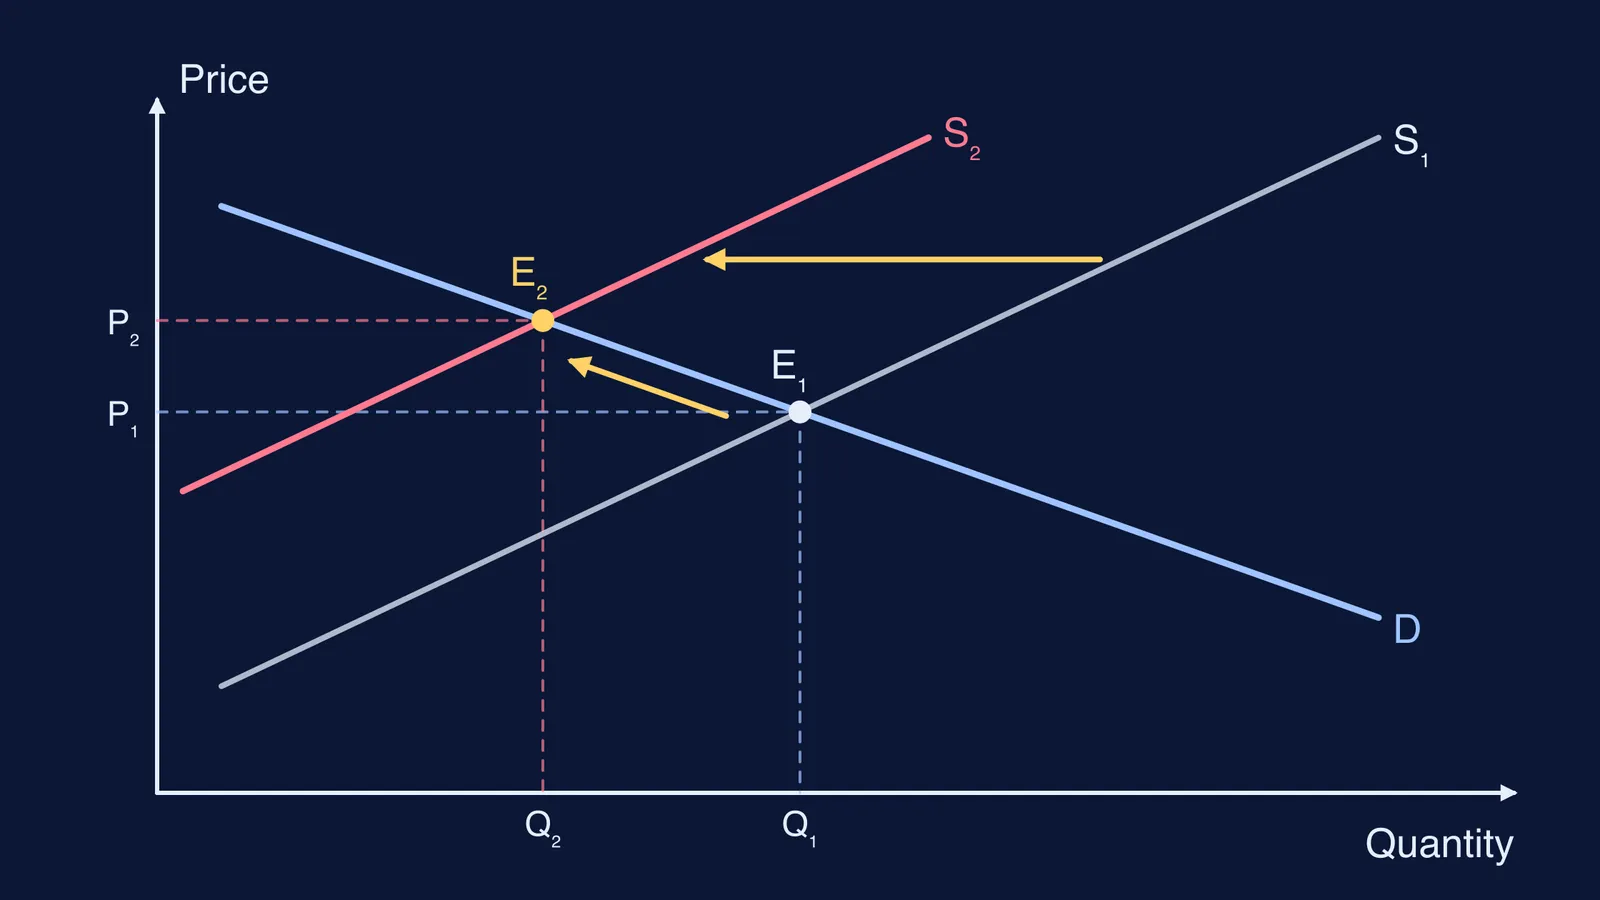
Draw demand D sloping down and supply S1 sloping up, crossing at E1.
Weather is a supply condition, so supply shifts left to S2: at every price, farmers have fewer onions to sell.
Buyers' incomes, tastes and the prices of related goods have not changed, so D stays put.
Mark the new crossing, E2: a higher price and a smaller quantity.
Now compare. "Demand falls and the demand curve shifts left" is wrong: buyers slide up the same demand curve from E1 to E2, so quantity demanded falls, not demand. "Supply shifts back to the right" is wrong for the same reason: the higher price moves farmers along S2, it does not move S2. One curve shifts; the equilibrium slides along the other, as in the diagram above.
A clean exam answer: supply decreases and the supply curve shifts left. The price rises, quantity demanded falls along the unchanged demand curve, and the new equilibrium has a higher price and a lower quantity.
How do you check an AI's economics answer with a sketch?
Do this before you read the AI's answer closely:
Draw your own D and S, mark the starting equilibrium, and write the one event in the question (rain, an income rise, a new tax) beside it.
Classify the event. The good's own price means a movement; anything else means a shift. Decide which curve, and which way.
Shift only that curve and mark the new equilibrium.
Underline every "demand" and "supply" in the AI's answer. Does each mean the whole curve, or the quantity at one point?
If the AI shifts a second curve, find the non-price reason it gives. If the only reason is the price change, cross that shift out.
If something does not match, push back with questions like these:
"Which factor other than the price of onions shifted the demand curve?"
"Is this a change in demand or a change in quantity demanded?"
"Where is the new equilibrium compared with the old one on each curve?"
Our guide on getting AI to check a graph sketch you describe in words uses the same habit for graphs, and why AI sounds confident when it is wrong explains the tone that hides these errors. For board exams, see drawing economics graphs for Class 12 exams.
Fermi's AI tutor draws the figure as it teaches and checks understanding as it goes, so you see the picture instead of taking a paragraph on trust.
Next time an answer about markets sounds smooth, draw the two curves first and let the sketch decide.