
On this page
A history chapter is a story of reasons. Questions like "Describe the circumstances leading to..." want the chain, not a list of facts, and a cause-and-effect chart puts that chain on one page. The catch: if an AI draws it for you, you get a neat picture and little memory of why the arrows go where they do. Build it yourself, then use AI as a sceptical examiner.
What is a cause-and-effect chart in history?
A cause-and-effect chart is a diagram of boxes (causes, events, effects) joined by arrows, where each arrow means "this made that more likely". It is a kind of node-link map, and a meta-analysis of 55 studies with 5,818 participants by Nesbit and Adesope found that constructing, modifying or viewing such maps, in subjects such as science and psychology, was associated with better knowledge retention.
Most history chapters need three kinds of box:
Long-term causes: conditions that built up over years (debt, unfair taxes, new ideas).
Triggers: the specific events that set things moving.
Effects: what changed as a result, short term and long term.
Unlike concept maps for science, history arrows run forward in time.
How do you make a cause-and-effect chart for a history chapter?
Read the chapter once, then close the book.
From memory, write each cause, event and result on its own sticky note or card, five words or fewer.
Open the book, add what you missed, and date every event card.
Sort the cards into three columns: long-term causes, triggers, effects.
Draw an arrow only if you can say the link as one "because" sentence. Write that sentence on the arrow.
Mark any arrow you are unsure about with a question mark. These are the ones to test with AI.
Worked example: the French Revolution chapter
Here is how a Class 9 student might chart the French Revolution chapter. Facts are checked against the French Revolution article on Wikipedia; your textbook is the final word for your exam.
Long-term causes:
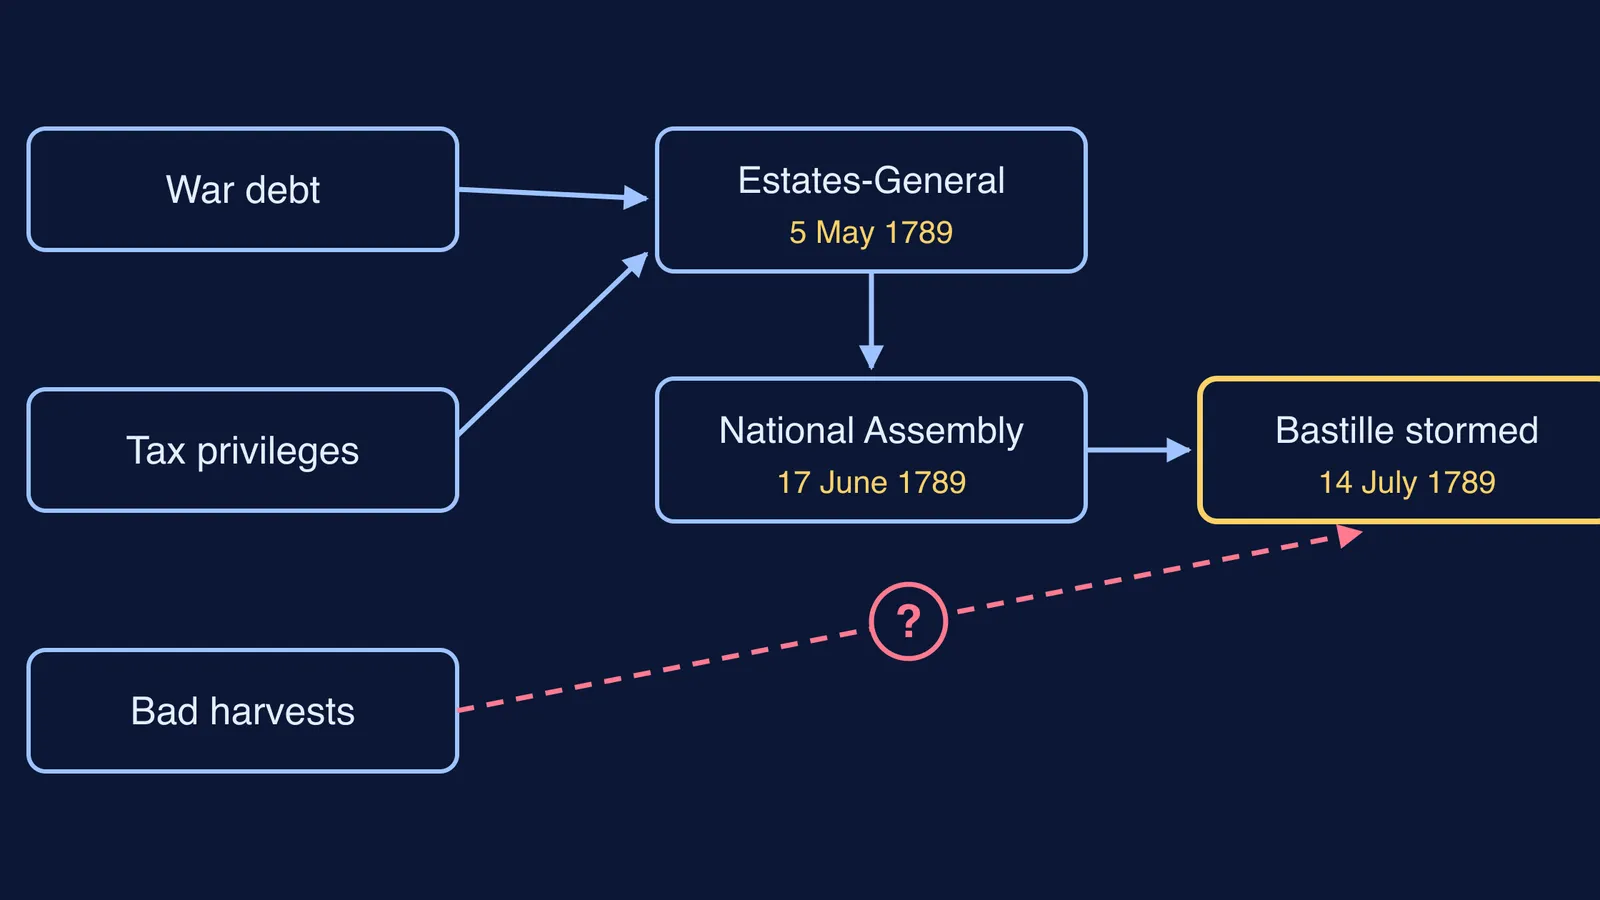
War debt: France borrowed to fund the 1778 to 1783 war with Britain, and by 1788 half of state revenue went on servicing its debt.
Tax privileges: the nobility and the Church had exemptions, so the tax burden fell mainly on ordinary people.
Bad harvests: poor harvests in 1787 and 1788 brought high food prices and unemployment.
Triggers and events:
5 May 1789: the Estates-General meets at Versailles, its first meeting since 1614, with votes counted by estate rather than by head.
17 June 1789: the Third Estate declares itself the National Assembly; its members then take the Tennis Court Oath not to disperse until a constitution is agreed.
14 July 1789: a crowd attacks the Bastille, a royal fortress holding arms and ammunition.
The student's arrows: debt and tax privileges lead to the Estates-General; voting by estate leads to the National Assembly; the National Assembly leads to the Bastille. One arrow is marked "?": bad harvests lead straight to the Bastille. It feels right but skips steps, which makes it the one to hand to AI.
What should you ask AI about your chart?
Type your chart as text ("A -> B because..."), paste it in, and use a script like this:
"Do not redraw my chart or give me a better one. Ask me one question at a time about my arrows."
"Which of my arrows is weakest, and what step might be missing in between?"
"Is any of my causes really a condition rather than a cause?"
"Give me one fact that would argue against my bad-harvests arrow."
Answer in your own words, fix the chart by hand, and check anything new against your textbook: AI can state wrong dates confidently.
Why hold back the AI? In a field experiment with nearly a thousand high school maths students, Bastani and colleagues found that students given a standard ChatGPT-style interface did better during practice but scored 17% lower than students without access once it was removed; a version with prompts designed to protect learning largely avoided that drop. Answering "why" questions about each link is also a known study technique: a review by Dunlosky and colleagues rated this "elaborative interrogation" as moderately useful. Our guide to asking AI why questions while you study has more prompts.
The same habit works in science chapters. Fermi's AI tutor is built to teach rather than answer: it notices where you are stuck and decides whether to explain, ask or show.
How do you turn the chart into exam answers?
Each arrow sentence is a ready-made point. For a long answer, walk the chart left to right: cause, trigger, effect, joined by "because" or "which led to". For source-based questions, find which box the extract belongs to; our guide to history source-based questions shows how to read the extract first.
Start with the chapter you have next, ten cards and one question mark.