On this page
You have drawn y = x²/(x − 1) in your notebook. It has two branches, a dashed line or two, and a dot you think is a minimum. Is it right? An AI chatbot can help you check, but only if you ask in a way that plays to its strengths, and you still confirm the result yourself.
Can AI check my sketch of a function graph?
It checks the reasoning behind a sketch better than the picture itself. Vision models still misread simple drawings. In the BlindTest study, four state-of-the-art vision language models averaged 58.07% accuracy on seven very simple visual tasks, such as counting how many times two lines cross (Rahmanzadehgervi et al., 2024). The researchers found the models struggled when shapes overlapped or sat close together, which often happens near an asymptote on a hand-drawn graph.
On harder maths-in-pictures questions, the gap remains. MathVista is a benchmark of 6,141 examples of mathematical reasoning in visual contexts (Lu et al., ICLR 2024). In that study, the best model tested, GPT-4V, reached 49.9% overall accuracy, 10.4 percentage points short of human performance. Newer models may do better, but a photo on its own still invites a confident "looks good!"
So describe first. For why chatbots slip on algebra at all, see our explainer on why AI makes maths mistakes.
How do I describe my sketch so AI can check it?
Turn the drawing into a list of claims. Each claim is something the AI can test with algebra rather than by squinting at your photo.
The function, typed exactly: y = x^2/(x - 1).
Intercepts: where you think it crosses each axis.
Asymptotes: vertical, horizontal or slanted, with their equations.
Turning points: coordinates, and whether each is a maximum or a minimum.
Behaviour: what happens as x gets very large or very negative, and on either side of each asymptote.
Then paste this script:
"Here is my sketch of y = x^2/(x - 1), described in words. Check each claim separately. For each one, show the working, say correct or wrong, and if it is wrong, point to the step I should redo. Do not redraw the graph for me."
You can attach a photo as well, but make the written list the thing being checked. Our guide to photographing a problem for AI covers lighting and cropping if you do.
What does a good check look like?
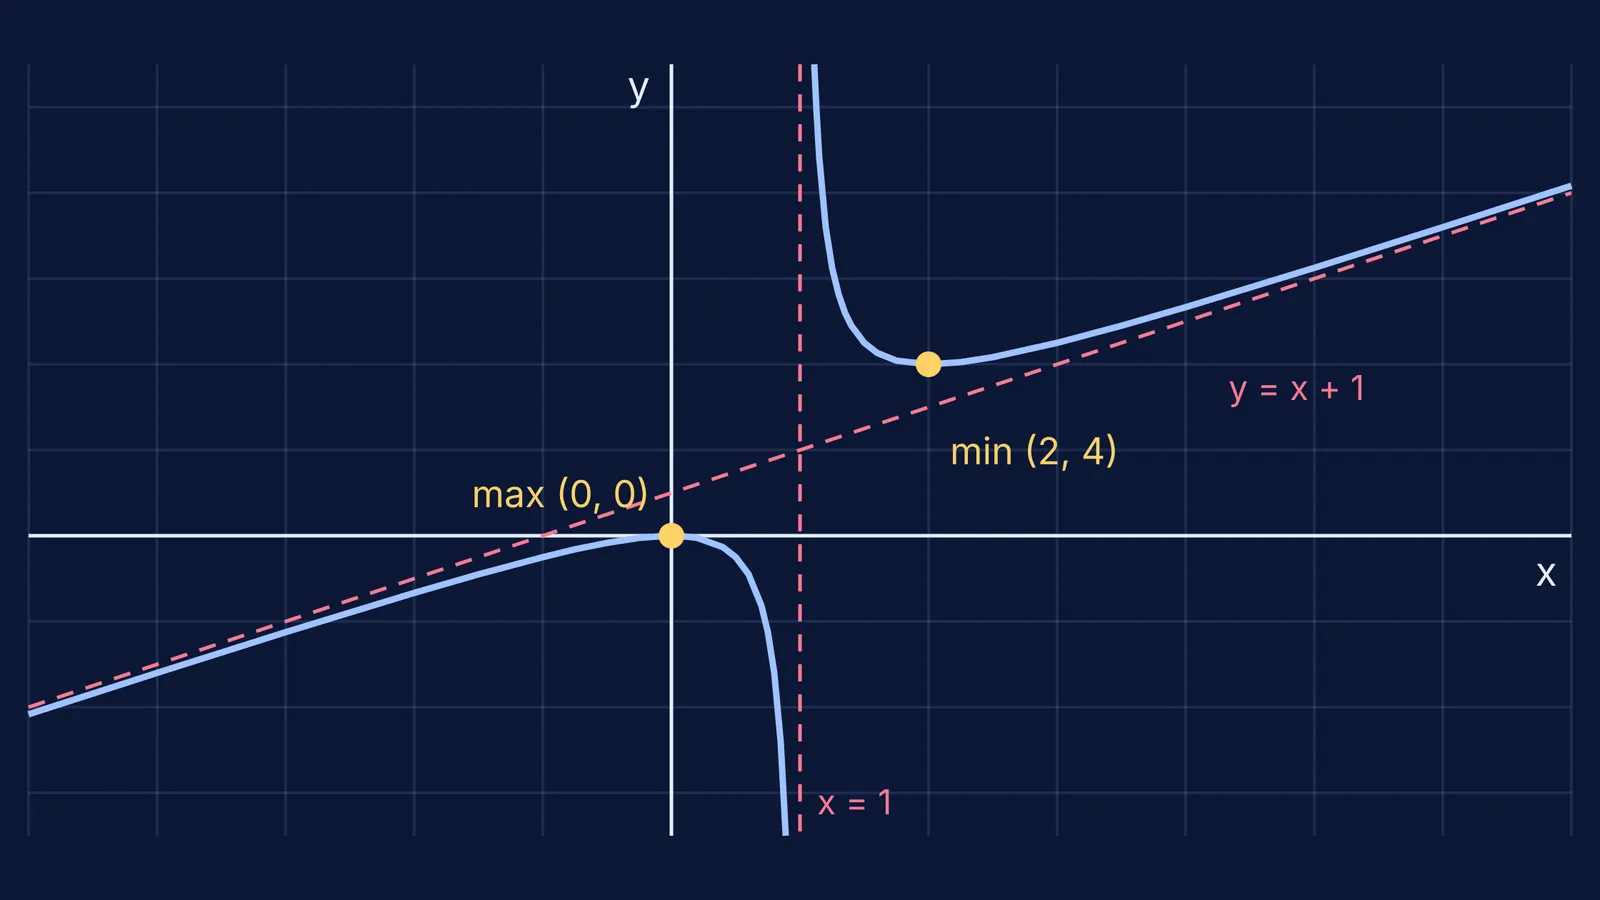
Say your description reads: crosses the axes only at the origin; vertical asymptote x = 1; horizontal asymptote y = 1; maximum at (0, 0); minimum at (2, 4).
A useful AI reply works through each claim:
Intercepts: y = 0 only when x = 0, and f(0) = 0, so the origin is the only intercept. Correct.
Vertical asymptote: the denominator is zero at x = 1 and the numerator is not, so x = 1 is an asymptote. Correct.
Horizontal asymptote: wrong. Dividing gives x²/(x − 1) = x + 1 + 1/(x − 1), so the graph approaches the slanted line y = x + 1, not a horizontal line.
Turning points: f′(x) = x(x − 2)/(x − 1)², which is zero at x = 0 and x = 2. f(0) = 0 is a local maximum and f(2) = 4 is a local minimum. Correct.
The surprise is that the minimum value (4) is higher than the maximum value (0). That is fine: they sit on different branches, separated by the asymptote. If the AI does not explain why, ask it to.
Check the AI's algebra as you would a classmate's. Do the division yourself and differentiate once with the quotient rule. If its working and yours disagree, neither is final yet.
Why confirm with a graphing tool at the end?
The AI checked your claims with algebra; a graphing tool checks them by plotting. Type the function into a graphing calculator such as GeoGebra, zoom out to see the slanted asymptote, then zoom in near x = 1 to watch the two branches shoot off in opposite directions. Our comparison of graphing tools for maths covers other options.
Do this last, not first. Plot before sketching and you are copying a picture; in an exam hall you need the reasoning behind it. Keep a short log: claim, your answer, the AI's answer, the plot. Where all three agree, move on. Where they disagree, you have found your next revision topic.
What if the same mistake keeps coming back?
If you keep missing slanted asymptotes, the gap is in the concept, not the drawing. The Fermi Concept Library has a lesson for every concept in mathematics, so you can revisit asymptotes before your next attempt. Fermi's AI tutor decides whether to explain, ask or show, and draws the figure as it teaches, so you can see where your sketch and the real curve part ways.
Your next step: pick one function from tonight's exercise, write its five claims, and run all three checks.