

On this page
Have you ever stared at a macroeconomics question in a mock exam, knowing the theory but blanking on the diagram? You are not alone. Graphs are the language of Class 12 Economics. When you learn to draw them accurately, you are not just memorising a picture—you are embedding the logic of the economy into your mind.
Why does drawing help you remember?
Research into how we learn shows that drawing is a surprisingly powerful memory tool. A 2016 study by Wammes, Meade, and Fernandes in the *Quarterly Journal of Experimental Psychology* found that drawing information significantly improves recall. In their experiments, drawn words were better recalled than written words https://doi.org/10.1080/17470218.2015.1094494.
This "drawing effect" happens because sketching a graph forces your brain to combine three things: the meaning of the concept (semantic), the visual shape (pictorial), and the physical movement of your hand (motoric). In economics, drawing a shift in Aggregate Demand physically connects your hand to the abstract idea of a changing economy.
How does the CBSE evaluate your graphs?
For the Class 12 board exams, the marking scheme treats your graph as a step-by-step mathematical proof. According to CBSE marking guidelines, examiners look for specific features, and a small omission can cost you marks.
Missing labels: Forgetting to label the X-axis (Income/Output) and Y-axis (Consumption/Saving/AD) typically costs marks https://cbseacademic.nic.in.
Incorrect intercepts: A Consumption curve must never start from the origin. It starts higher on the Y-axis to show autonomous consumption.
The 45° reference line: In income determination diagrams, the 45° line (where Income equals Aggregate Supply) is mandatory.
How do you derive the saving curve from the consumption curve?
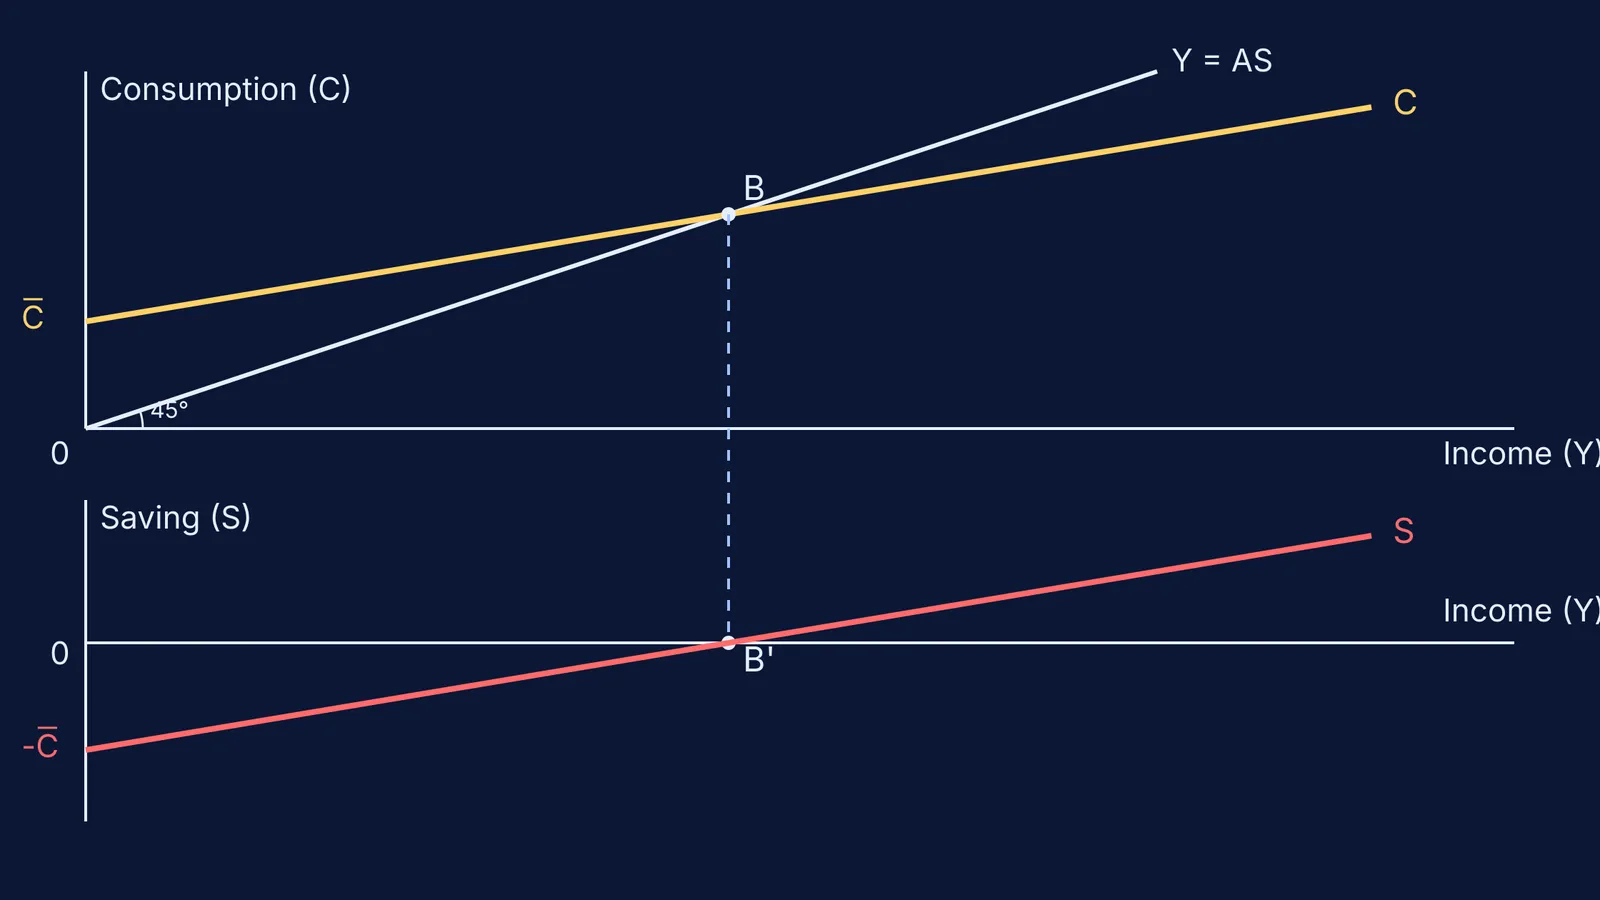
One of the most frequently tested 4-to-6 mark questions is deriving the Saving curve (S) from the Consumption curve (C). Here is the exact sequence you should follow:
Draw the top panel (Consumption): Set up your axes and draw the 45° reference line from the origin (Y = AS).
Plot the Consumption curve: Start the C curve on the positive Y-axis to represent autonomous consumption. Draw it upward sloping, but flatter than the 45° line. Where C and the 45° line intersect is the Break-even point (B). At this point, Income equals Consumption.
Set up the bottom panel (Saving): Draw a new set of axes directly below the first one, sharing the same X-axis (Income).
Mark the intercepts: Drop a dashed line straight down from the Break-even point (B) to the lower X-axis. This marks where Saving is zero (B'). Then, mark a point on the negative Y-axis of the lower panel that matches the height of autonomous consumption.
Draw the Saving curve: Draw a straight line starting from the negative intercept and passing through B'. This is your Saving curve.
How do you explain shifts in standard diagrams?
Drawing the shift is only half the battle; explaining what happens next is where you secure the final marks. Whether it is an inflationary gap shifting Aggregate Demand upwards or a change in investment shifting the Investment curve, follow a set script for your explanation:
State the original equilibrium: Always start by identifying the initial intersection. Write, "Initially, the economy is in equilibrium at point E, where AD = AS, yielding an income of Y."
Identify the catalyst: Name the variable that caused the shift. For example, "An increase in investment causes the Aggregate Demand curve to shift upwards from AD to AD₁."
Describe the new equilibrium: Trace the new intersection. "The new equilibrium is established at E₁, where the new AD₁ curve intersects the AS line."
Conclude with the result: End with the final impact on income, output, or employment. "Consequently, the equilibrium level of income increases from Y to Y₁."
Using this predictable script prevents you from rambling and ensures the examiner sees exactly how the graphical shift translates into economic theory.
What is the checklist for a perfect diagram?
Before you move on to the next question in your exam, run through this quick checklist:
Are both the X-axis and Y-axis labelled with their full names (e.g., "Income (Y)")?
Is the origin marked as "0" on all axes?
Do the curves start at the correct intercept (positive, negative, or origin)?
Have you labelled the equilibrium points (e.g., E, B)?
Have you added a brief title underneath the graph (e.g., "Derivation of Saving Curve")?
If you are struggling to picture these abstract models, Fermi's AI tutor can run a simulation and draw the figure step-by-step, checking your understanding as it goes. For more on visualising data, read about William Playfair and the bar chart: drawing numbers for the eye, or practice converting PV, PT and VT graphs of ideal gas processes.


