
On this page
This sheet covers NCERT Class 11 Mathematics, Chapter 13, Statistics (reprint 2026-27), checked against the CBSE Mathematics curriculum for 2026-27, which lists range, mean deviation, variance and standard deviation of ungrouped and grouped data. Not included: quartile deviation, which the chapter names but does not study, and coefficient of variation, which is not in the current text. For the ideas behind each measure, read our Statistics Class 11 guide to mean deviation, variance and SD.
Symbols used throughout: x₁, x₂, …, xₙ are observations (or class mid-points), fᵢ is the frequency of xᵢ, N = Σfᵢ, x̄ is the mean, M the median, and Σ runs over i = 1 to n.
Range and the averages you need first
Range = maximum value − minimum value.
Mean, ungrouped: x̄ = (Σxᵢ)/n.
Mean, grouped: x̄ = (Σfᵢxᵢ)/N. For classes, xᵢ is the mid-point of each class.
Step-deviation mean: dᵢ = (xᵢ − a)/h, then x̄ = a + (Σfᵢdᵢ/N) × h, where a is an assumed mean and h a common factor (usually the class width).
Median of a continuous distribution: M = l + ((N/2 − C)/f) × h, where the median class is the first class whose cumulative frequency is equal to or just greater than N/2; l, f and h are its lower limit, frequency and width, and C is the cumulative frequency of the class just before it.
The deviations from the mean always add to zero: Σfᵢ(xᵢ − x̄) = 0.
Example: the data 3, 5, 6, 8, 9, 11, 14, 24 have range 24 − 3 = 21. For classes 0-10, 10-20, 20-30, 30-40, 40-50 with frequencies 5, 8, 12, 10, 5: N = 40, cumulative frequencies 5, 13, 25, 35, 40, so the median class is 20-30 and M = 20 + ((20 − 13)/12) × 10 ≈ 25.83.
Watch for: C is the cumulative frequency of the class before the median class (13 here), not of the median class itself (25).
How do you find mean deviation about the mean or median?
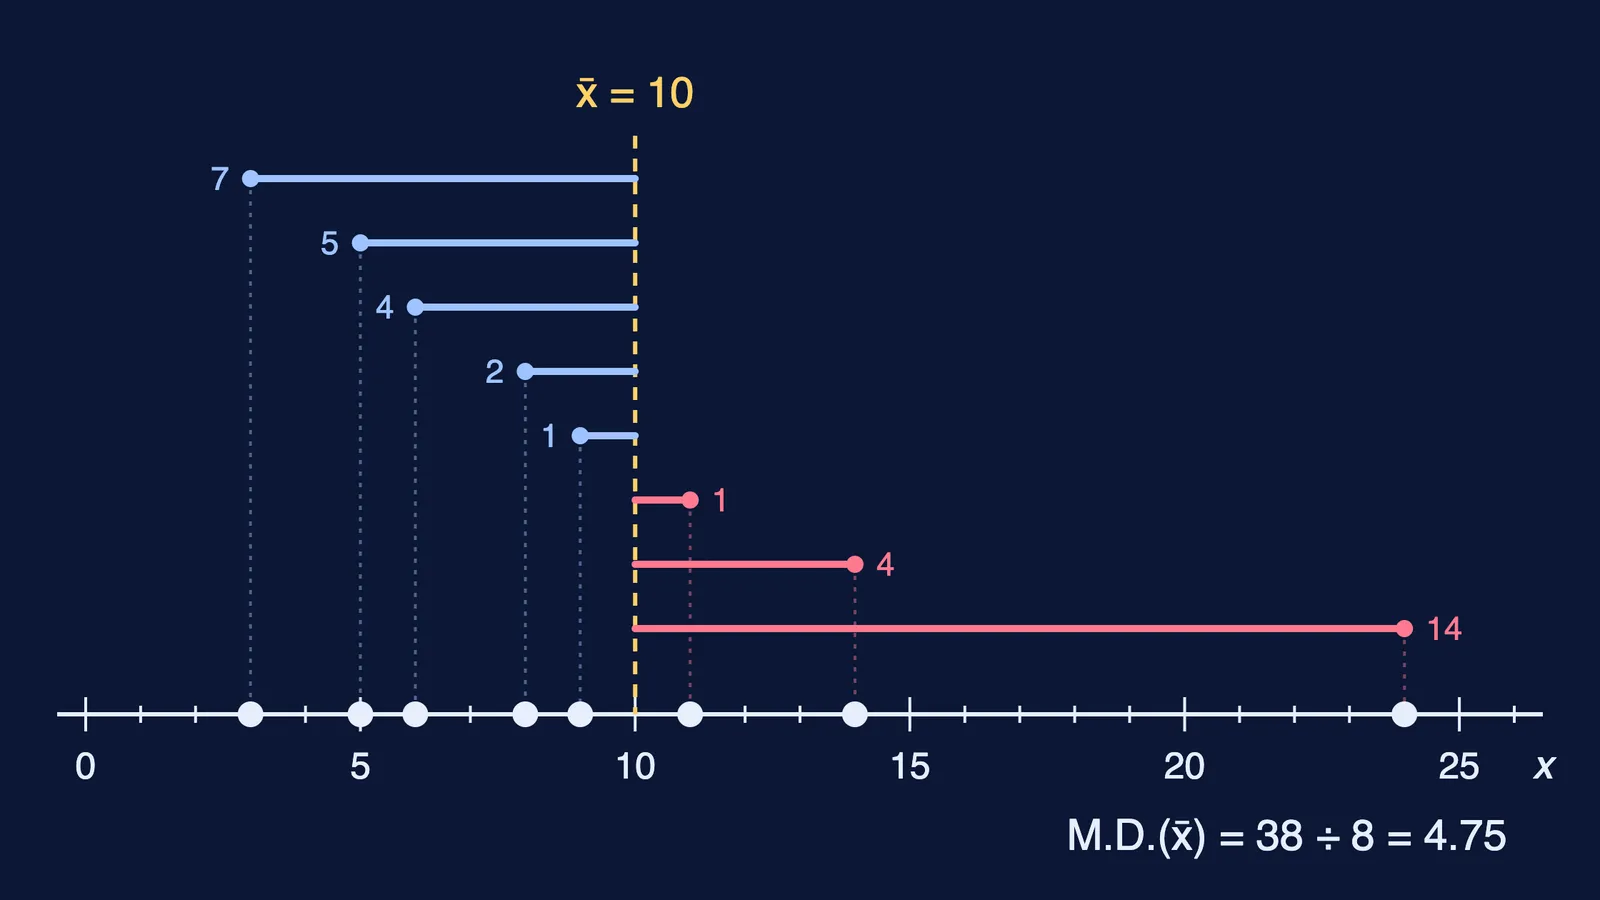
Mean deviation about a central value a is the mean of the absolute deviations: M.D.(a) = Σ|xᵢ − a|/n.
Ungrouped: M.D.(x̄) = (1/n) Σ|xᵢ − x̄| and M.D.(M) = (1/n) Σ|xᵢ − M|.
Discrete frequency distribution: M.D.(x̄) = (1/N) Σfᵢ|xᵢ − x̄| and M.D.(M) = (1/N) Σfᵢ|xᵢ − M|.
Continuous frequency distribution: the same two formulas, with xᵢ the class mid-points and M from the median formula above.
Example: for 3, 5, 6, 8, 9, 11, 14, 24, x̄ = 80/8 = 10. The absolute deviations are 7, 5, 4, 2, 1, 1, 4, 14, which add to 38, so M.D.(x̄) = 38/8 = 4.75. The median is (8 + 9)/2 = 8.5, the absolute deviations from it add to 36, and M.D.(M) = 36/8 = 4.5.
Watch for: in grouped data, divide by N = Σfᵢ, not by the number of classes, and multiply each |xᵢ − x̄| by its frequency before adding.
What are the variance and standard deviation formulas?
Variance σ² is the mean of the squared deviations from the mean; standard deviation σ is its positive square root, so it has the same unit as the data.
Ungrouped: σ² = (1/n) Σ(xᵢ − x̄)² and σ = √[(1/n) Σ(xᵢ − x̄)²].
Discrete frequency distribution: σ² = (1/N) Σfᵢ(xᵢ − x̄)² and σ = √[(1/N) Σfᵢ(xᵢ − x̄)²].
Continuous frequency distribution: the same, with xᵢ the class mid-points.
Another form: σ² = (1/N) Σfᵢxᵢ² − x̄², which gives σ = (1/N) √[N Σfᵢxᵢ² − (Σfᵢxᵢ)²].
Example: x = 2, 4, 6, 8, 10 with f = 2, 5, 6, 5, 2. N = 20 and Σfᵢxᵢ = 120, so x̄ = 6. Then Σfᵢ(xᵢ − 6)² = 32 + 20 + 0 + 20 + 32 = 104, σ² = 104/20 = 5.2 and σ = √5.2 ≈ 2.28. Check with the other form: Σfᵢxᵢ² = 824, and 824/20 − 6² = 41.2 − 36 = 5.2.
Watch for: in σ² = (1/N) Σfᵢxᵢ² − x̄², the last term is the square of the mean, not the mean of the squares.
How does the shortcut method for variance work?
When the mid-points are large, shift and scale them first.
Step-deviations: yᵢ = (xᵢ − A)/h, so xᵢ = A + hyᵢ, where A is the assumed mean and h the class width.
Mean: x̄ = A + h ȳ, where ȳ = (Σfᵢyᵢ)/N.
Variance: σₓ² = h² σᵧ², so σₓ = h σᵧ.
Shortcut formulas: σ² = (h²/N²) [N Σfᵢyᵢ² − (Σfᵢyᵢ)²] and σ = (h/N) √[N Σfᵢyᵢ² − (Σfᵢyᵢ)²].
Example: classes 20-30, 30-40, 40-50, 50-60, 60-70 with frequencies 4, 6, 10, 7, 3. Mid-points are 25 to 65; take A = 45 and h = 10, so y = −2, −1, 0, 1, 2. N = 30, Σfᵢyᵢ = −1 and Σfᵢyᵢ² = 41. Then x̄ = 45 + 10 × (−1/30) ≈ 44.67, and σ = (10/30) √(30 × 41 − 1) = (1/3) √1229 ≈ 11.69. The direct method gives the same variance, 1229/9 ≈ 136.56.
Watch for: the variance carries h², not h. Using h instead gives about 13.66 here, ten times too small.
How to revise this formula sheet
Write each formula on a card with its condition on the back: which central value, divide by n or N, mid-points for classes.
Rework the four examples with one frequency changed, then check the variance both ways: from the definition and from σ² = (1/N) Σfᵢxᵢ² − x̄².
For every grouped question, build the same table columns in the same order: xᵢ, fᵢ, yᵢ, fᵢyᵢ, fᵢyᵢ². A slip in one column total carries into every step after it.
Test yourself with our Statistics Class 11 case study questions and the Statistics Class 11 assertion-reason set.
If you cannot see where a calculation went wrong, the Fermi Problem Library has worked problems with a step-by-step solver that explains the reasoning rather than printing an answer.