
On this page
Production and Costs is Chapter 3 of NCERT's Introductory Microeconomics (Reprint 2026-27). It asks how much output inputs give, and what that output costs. This guide joins the two with one table; for depth, read our posts on the production function, TP, AP and MP and on short-run cost curves with a worked table.
What does Production and Costs cover in the 2026-27 syllabus?
In the CBSE Economics curriculum for 2026-27, the chapter falls under Unit 6, Producer Behaviour and Supply. Unit 6 carries 14 marks of the 80-mark Class XI theory paper, shared with revenue, producer's equilibrium and supply, so there is no separate chapter figure.
The Unit 6 list names:
meaning of the production function, short run and long run
total, average and marginal product
returns to a factor
short-run costs: TC, TFC, TVC, AC, AFC, AVC and MC, their meaning and relationships
NCERT also has sections on returns to scale (3.6) and long-run costs (3.7.2). The 2026-27 Unit 6 list names neither, so this guide leaves them out.
How does the production function lead to cost curves?
A production function gives the maximum output from given inputs, for a given technology (NCERT Chapter 3). In the short run at least one factor is fixed, so output rises only by adding a variable factor such as labour.
The law of variable proportions says the marginal product of that factor first rises, then falls once the fixed factor gets crowded. NCERT links this to cost: with the factor price given, each extra unit of output first needs less of the factor, then more, so marginal cost falls, then rises. Hence the U-shaped SMC curve: cost mirrors production.
One table from TP to MC: a bakery example
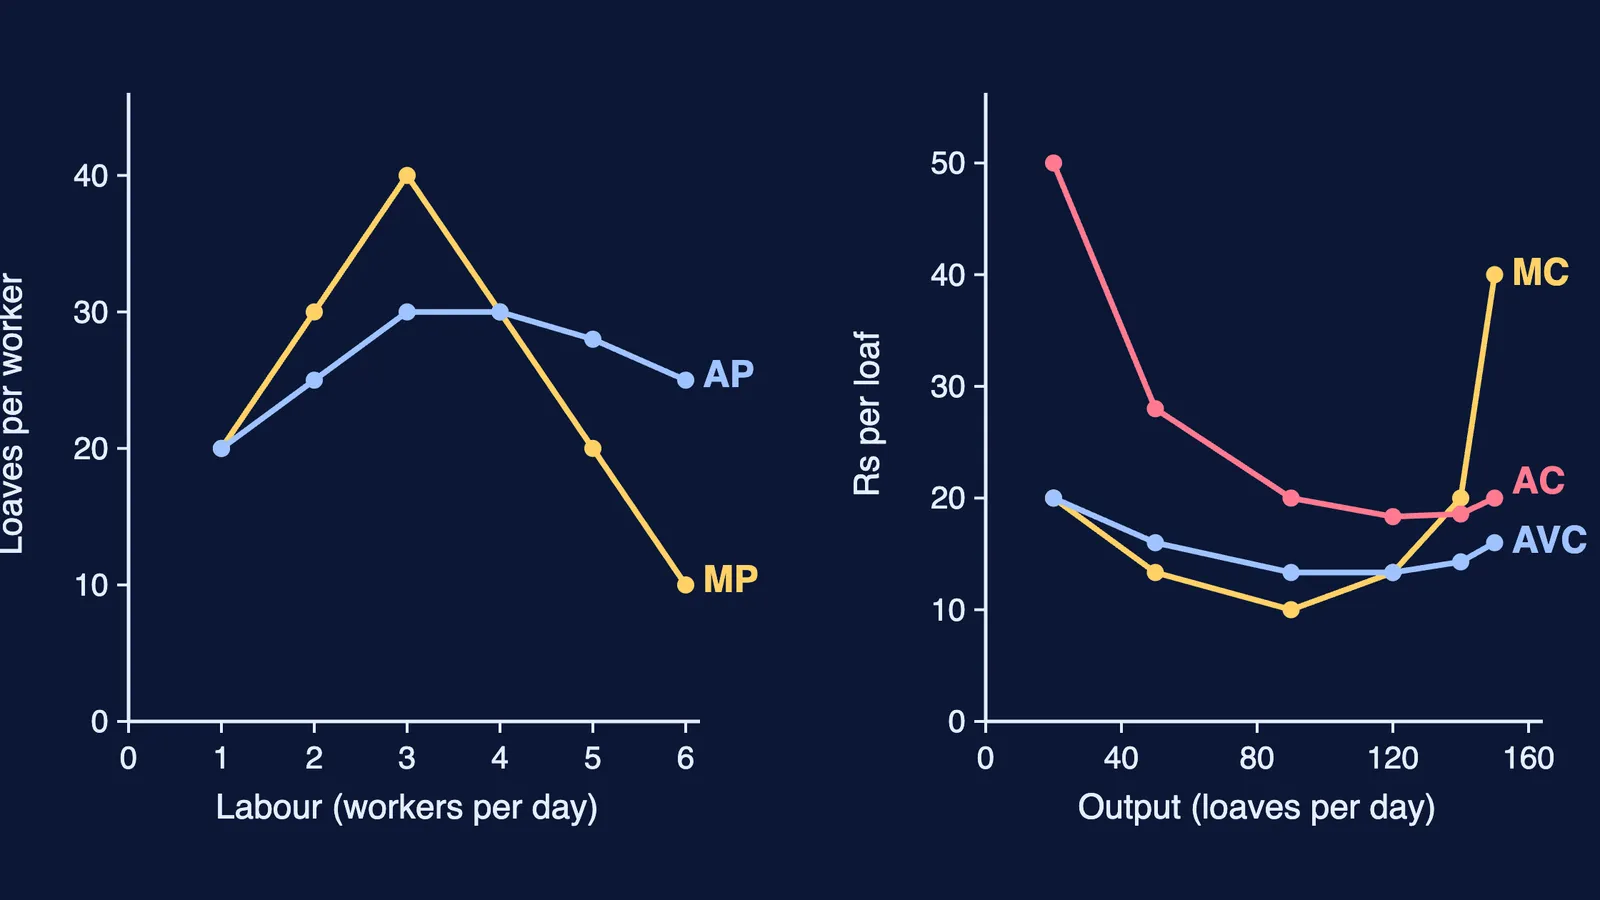
A small bakery rents an oven for Rs 600 a day (TFC). Each worker costs Rs 400 a day, the only variable cost. Our own numbers, checked in Python; output (q = TP) is loaves per day.
Labour L: 1, 2, 3, 4, 5, 6
TP: 20, 50, 90, 120, 140, 150
MP: 20, 30, 40, 30, 20, 10
AP: 20, 25, 30, 30, 28, 25
TVC = 400 × L: 400, 800, 1200, 1600, 2000, 2400
TC = 600 + TVC: 1000, 1400, 1800, 2200, 2600, 3000
AFC: 30, 12, 6.67, 5, 4.29, 4
AVC: 20, 16, 13.33, 13.33, 14.29, 16
AC: 50, 28, 20, 18.33, 18.57, 20
MC = ΔTC ÷ Δq: 20, 13.33, 10, 13.33, 20, 40
One row in full, for the fourth worker:
TP rises from 90 to 120, so MP = 30 and AP = 120 ÷ 4 = 30.
TC = 600 + 1,600 = 2,200, so AC = 2,200 ÷ 120 = 18.33, which equals AFC 5 + AVC 13.33.
MC = (2,200 − 1,800) ÷ (120 − 90) = 400 ÷ 30 = 13.33 per loaf.
Output moves in steps, so MC is the extra cost per loaf over each step. MC times each step, added up, gives TVC of 2,400.
What are the key relationships to remember?
From NCERT's chapter summary, with the bakery's numbers:
MP and AP: MP cuts AP from above at the highest AP.
MC and AVC: SMC cuts AVC from below at its minimum. Both are 13.33 at 120 loaves.
MC and AC: SMC cuts AC from below at its minimum. AC is lowest at 120 loaves (18.33); the next MC (20) is above it, so AC rises.
AC = AVC + AFC; the gap shrinks as AFC falls from 30 to 4.
AFC falls throughout: AFC × q is always 600.
Practice questions on Production and Costs
Written for this guide, not taken from NCERT.
TP for L = 0 to 5 is 0, 8, 20, 30, 36, 38. Find MP and AP, and the labour level where MP starts to fall. Answer: MP 8, 12, 10, 6, 2; AP 8, 10, 10, 9, 7.6; MP falls after the second worker.
TFC is Rs 300 and TC for q = 1 to 5 is 400, 460, 510, 580, 680. Find MC and AVC, and show that MC equals AVC at the lowest AVC. Answer: MC 100, 60, 50, 70, 100; AVC 100, 80, 70, 70, 76; at q = 4 both are 70.
AVC is Rs 30 at 10 units, and the 11th unit adds Rs 25. Does AVC rise or fall? Answer: AVC = 325 ÷ 11 = Rs 29.55; it falls because MC is below AVC.
The curriculum's question design puts 30% of marks on applying knowledge, so practise full tables.
How should you revise this chapter?
Build one table like the bakery's from your own numbers, then sketch both panels. If you are not sure where to start, Fermi's AI tutor can work out what you already know and build a plan for the session. Next in Unit 6, MC becomes the firm's supply curve: see our guide to the law of supply and market equilibrium.