On this page
If the Class 11 chapter on producer behaviour feels like a wall of TP, AP and MP, the whole idea fits in one table. In CBSE's Economics curriculum for Class XI (2026-27), Unit 6, Producer Behaviour and Supply, opens with the meaning of the production function, total, average and marginal product, and returns to a factor. The unit carries 14 marks.
What is a production function in Class 11 economics?
The production function of a firm is the relationship between inputs used and output produced: for given quantities of inputs, it gives the maximum quantity of output that can be produced, according to NCERT's Introductory Microeconomics, Chapter 3. It is written q = f(L, K), where L is labour, K is capital and q is the maximum output.
"Maximum" means the inputs are used efficiently, and the function holds for a given technology: better technology gives a new production function, NCERT notes.
In the short run, at least one factor stays fixed; in the long run, all factors can be varied, the same NCERT chapter says.
How do you calculate TP, AP and MP?
Keep capital fixed and change only labour. Then:
Total product (TP) is the output you get at each level of the variable input, with all other inputs held constant.
Average product (AP) is output per unit of the variable input: AP = TP ÷ L.
Marginal product (MP) is the change in output per unit change in the input: MP = ΔTP ÷ ΔL. With one-unit steps, MP at L = TP at L minus TP at L − 1.
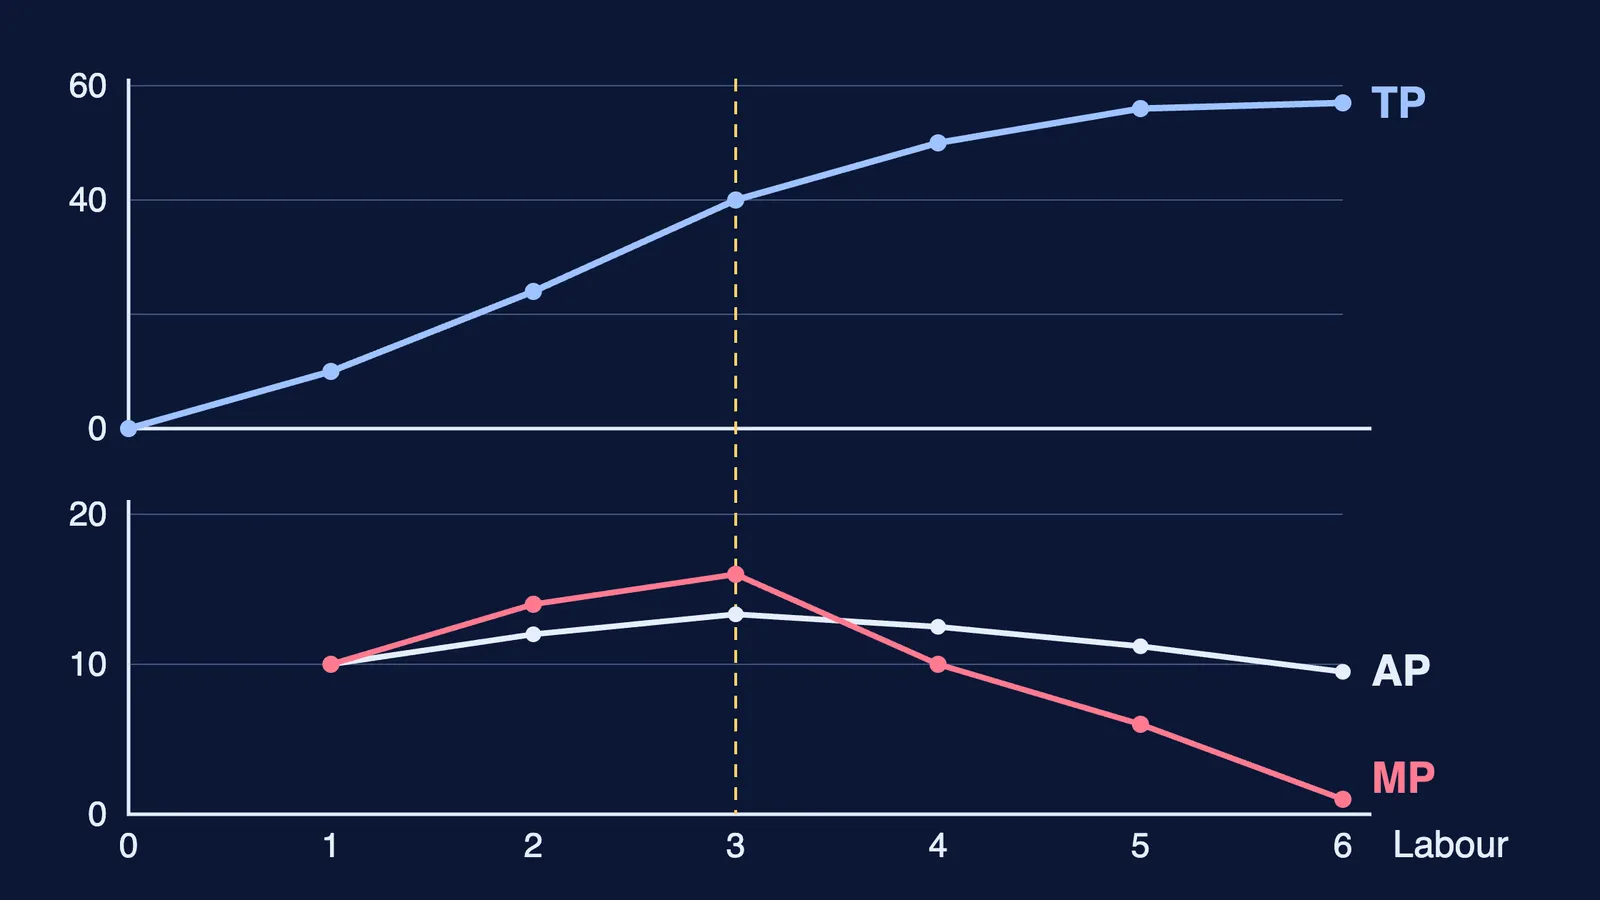
NCERT's Table 3.2 fixes capital at 4 units (NCERT Chapter 3). As labour goes from 1 to 6 units, TP is 10, 24, 40, 50, 56 and 57. MP is 10, 14, 16, 10, 6 and 1. AP is 10, 12, 13.33, 12.5, 11.2 and 9.5. MP peaks at the third unit of labour, and the marginal products sum to total product: 10 + 14 + 16 + 10 + 6 + 1 = 57.
What does the law of variable proportions say?
The law of variable proportions, also called the law of diminishing marginal product, says the marginal product of a factor first rises as more of it is employed and, after a certain level of employment, starts falling (NCERT Chapter 3).
The reason is the ratio in which the inputs are combined. NCERT's example is a farmer with 4 hectares: one worker has too much land, so early workers each add more than the last; from the fourth worker the land gets crowded and each adds less.
While MP is above AP, AP rises; once MP drops below AP, AP falls. So MP and AP are both inverse U-shaped, and the MP curve cuts the AP curve from above at AP's highest point.
A worked example: a roti stall with one tandoor
Here is a practice table we made up, following the shapes NCERT describes in Chapter 3. A roadside stall has one tandoor (the fixed factor) and hires cooks (the variable factor). Output is rotis per hour, listed as TP, MP, AP:
One cook: 20, 20, 20
Two cooks: 50, 30, 25
Three cooks: 90, 40, 30
Four cooks: 120, 30, 30
Five cooks: 140, 20, 28
Six cooks: 150, 10, 25
Seven cooks: 145, −5, about 20.7
What to read from it:
MP rises to 40 with the third cook, then falls: the law of variable proportions.
AP tops out at 30, at three and four cooks; by the fourth cook MP has fallen to meet it. That is MP cutting AP at its maximum.
TP peaks at six cooks. The seventh crowds the tandoor, so MP turns negative and TP falls; NCERT's table stops before this.
The check still works: 20 + 30 + 40 + 30 + 20 + 10 − 5 = 145.
If ΔTP ÷ ΔL keeps tripping you up, the Fermi Problem Library has a step-by-step solver that explains the reasoning rather than printing an answer.
How should you revise TP, AP and MP for the exam?
A five-day plan, about 30 minutes a day:
Day 1: write the four definitions from NCERT, then say them aloud without looking.
Day 2: compute AP and MP from the TP column of Table 3.2 alone.
Day 3: sketch TP, MP and AP; mark where MP peaks and where it cuts AP.
Day 4: change the roti numbers and swap tables with a friend.
Day 5: explain in three lines why MP falls, using factor proportions, not tiredness.
For other economics diagrams, see our guide to checking a demand and supply shift diagram. If Class 11 feels like a jump, read why Class 10 toppers can struggle in Class 11. If average and marginal still blur, look them up in the Fermi Concept Library, then redo the roti table.