On this page
Supply and market equilibrium sit back to back in CBSE Class 11 Economics. The CBSE Economics curriculum for 2025-26 lists the supply schedule, the supply curve and its slope, movements along and shifts in the curve, and price elasticity of supply under Unit 6, then market equilibrium and the effects of shifts in demand and supply (short run only) under Unit 7. Check your school's copy for the current session. Below, one set of NCERT numbers takes you from a supply schedule to the equilibrium price.
What is the law of supply in Class 11?
In NCERT's words, the supply curve shows the levels of output that a firm chooses to produce at different market prices (NCERT Introductory Microeconomics, Chapter 4).
The law of supply is the pattern that curve usually shows: when the supply curve is positively sloped, a rise in price raises the quantity supplied, so the price elasticity of supply is positive, as the same chapter puts it.
Why? A firm's short-run supply curve is the rising part of its marginal cost curve above minimum average variable cost, so a higher price makes extra units worth producing.
The market supply curve is the horizontal sum of every firm's supply: at each price, add up what each firm offers (NCERT Chapter 4).
How do you build a supply schedule?
NCERT's wheat example uses the market supply curve qS = 120 + p for prices of ₹10 per kg and above (NCERT Introductory Microeconomics, Chapter 5). Put in a few prices and you have a schedule:
₹20 per kg: 140 kg supplied
₹30 per kg: 150 kg supplied
₹40 per kg: 160 kg supplied
₹45 per kg: 165 kg supplied
Moving down this list is a movement along one supply curve. Only the good's own price changed.
Movement along vs shift in supply: what is the difference?
A shift means the whole curve moves, because something other than the good's own price changed. NCERT Chapter 4 names four causes, three in its summary and the fourth in its section on market supply (NCERT Chapter 4):
Technological progress shifts supply to the right.
A rise in input prices shifts supply to the left; a fall shifts it right.
A unit tax shifts supply to the left.
More firms in the market shift market supply to the right.
Checking diagrams with a chatbot? See how to check an AI's demand-supply shift diagram.
How is equilibrium price determined?
NCERT defines equilibrium as the situation where market supply equals market demand, so there is zero excess demand and zero excess supply (NCERT Chapter 5).
In the wheat example, demand is qD = 200 − p and supply is qS = 120 + p. Set them equal:
200 − p = 120 + p
2p = 80, so p* = ₹40 per kg
q* = 200 − 40 = 160 kg
Test a price on each side, as the textbook does. At ₹25, buyers want 175 kg but sellers offer 145 kg: excess demand pushes price up. At ₹45, sellers offer 165 kg but buyers want 155 kg: excess supply pushes price down. Only at ₹40 do plans match.
What happens to equilibrium when supply shifts?
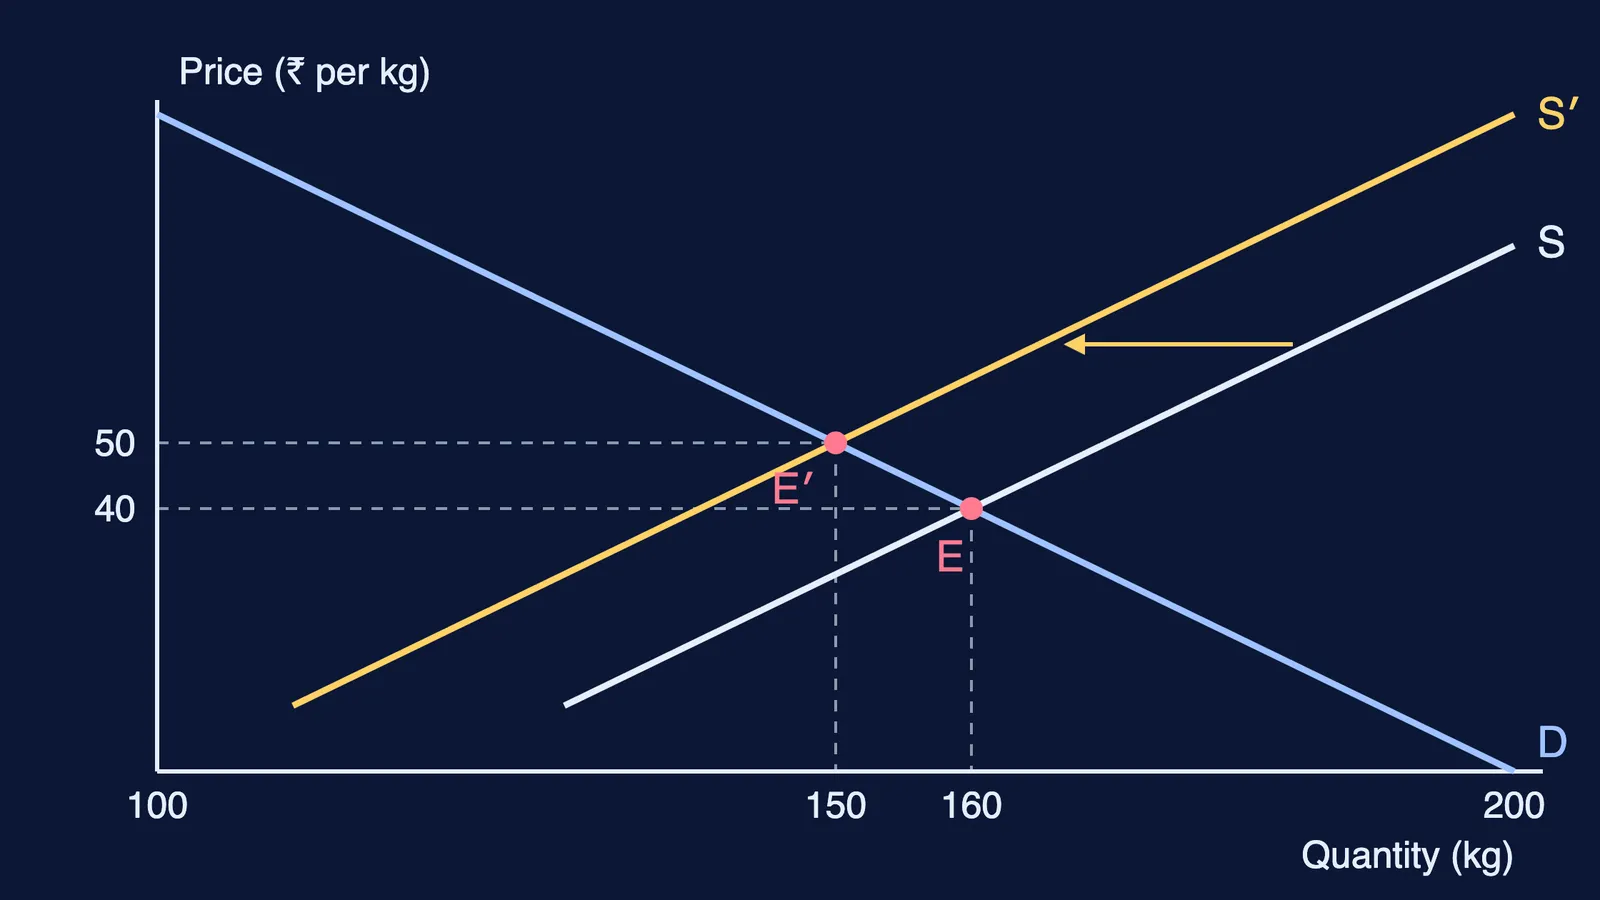
NCERT's rule is short: when the supply curve shifts, equilibrium price and quantity move in opposite directions; when demand shifts, they move in the same direction (NCERT Chapter 5). A rise in input prices shifts supply left, so price rises and quantity falls.
Here is that case with numbers (our extension of the textbook example). Suppose costs rise and farms offer 20 kg less at every price, so supply becomes qS = 100 + p. Then 200 − p = 100 + p gives p = ₹50 and q = 150 kg. Price went up by ₹10 and quantity fell by 10 kg, exactly the direction the rule predicts. The diagram at the top plots both equilibria.
If solving two straight-line equations or reading a slope is the step that slows you down, the Fermi Concept Library has a lesson on each mathematics concept, and the Fermi Problem Library works problems step by step and explains the reasoning rather than printing an answer.
A 25-minute practice plan
Five minutes: write the definitions of supply curve, market supply and equilibrium from memory; check them against NCERT.
Five minutes: build a market supply schedule from NCERT Chapter 4 exercises 22 to 24.
Five minutes: solve the wheat equilibrium without looking, then find excess demand at ₹30.
Five minutes: draw the four supply shifts and mark which way price and quantity move.
Five minutes: explain the shift rule aloud to someone at home.
For prices in daily life, try building a samosa price index to understand inflation.