
On this page
Organisation of Data is Chapter 3 of the NCERT Class 11 textbook Statistics for Economics (Reprint 2026-27). It turns a messy list of numbers into a frequency distribution you can read at a glance.
What does organisation of data mean in Class 11 economics?
Raw data sit in no order, so even finding the highest value means sorting everything. Classification arranges data into groups or classes based on some criterion, so you can locate, compare and draw conclusions (NCERT Chapter 3).
NCERT describes four ways to classify:
Chronological: by time (years, months). A variable recorded this way is a time series.
Spatial: by place (countries, states, cities).
Qualitative: by attributes that cannot be measured, such as gender, then marital status.
Quantitative: by measurable characteristics such as height, income or marks.
What is the difference between continuous and discrete variables?
A continuous variable may take any value within a range, including fractions: height, weight, time. A discrete variable moves in jumps, such as how many children sit in a classroom (25 or 26, never 25.5). It can still take fractions, as long as it never takes values between neighbours: NCERT's example runs 1/8, 1/16, 1/32.
For a discrete variable, the classification is a frequency array: one frequency for each value, such as household size.
How do you make a frequency distribution?
A frequency distribution shows how the values of a quantitative variable spread across classes, with the number of values (class frequency) in each. Key terms:
Class limits: the lower and upper ends of a class.
Class interval (width): upper limit minus lower limit.
Class mark (mid-point): (upper class limit + lower class limit) / 2.
NCERT advises six to fifteen classes in most cases. With equal widths, number of classes = range / class width, where range is the largest value minus the smallest.
Exclusive classes (300–350, 350–400): a value equal to a limit goes into only one class, decided in advance.
Inclusive classes (300–349, 350–399): both limits belong to the class. To restore continuity, halve the gap between classes, subtract it from every lower limit and add it to every upper limit.
Use unequal classes when the range is huge (income) or values bunch together. Avoid open-ended classes like "70 and over".
Worked example: daily wages of 30 workers
Our own figures, not NCERT's: daily wages (Rs) of 30 workers.
412, 356, 500, 449, 371, 588, 431, 463, 312, 400, 494, 362, 450, 515, 405, 384, 477, 348, 442, 561, 418, 390, 532, 458, 425, 335, 470, 397, 436, 486
Range: 588 − 312 = 276.
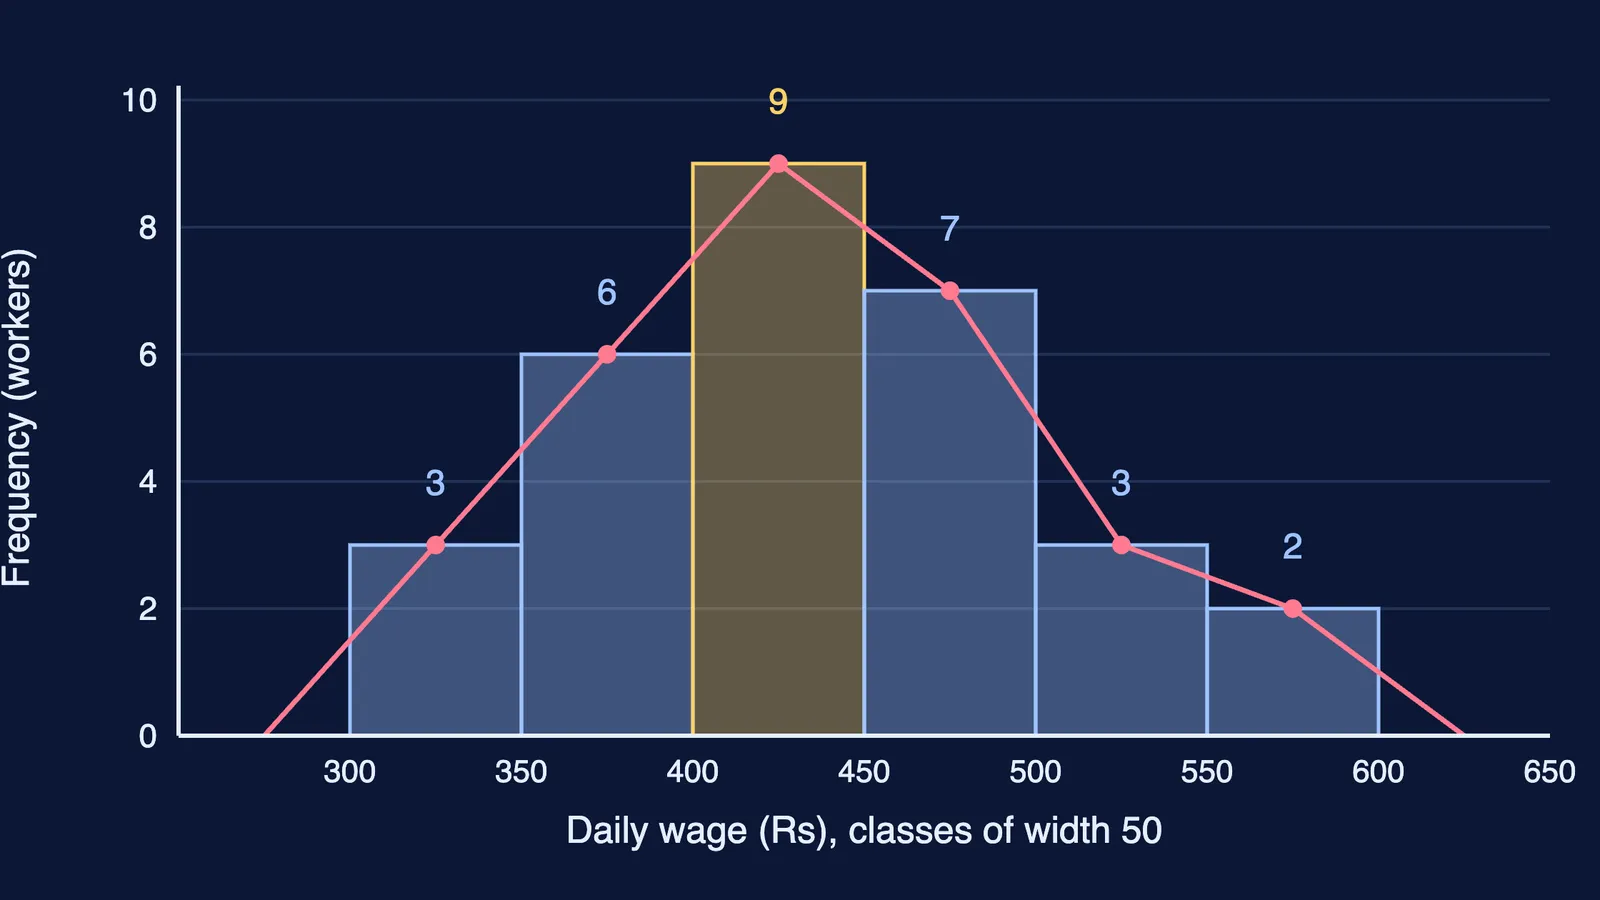
Classes: with a width of 50, 276 / 50 = 5.52, so we need 6 classes, starting at 300.
Tally each value, upper limit excluded. 400, 450 and 500 sit on boundaries, so they go into 400–450, 450–500 and 500–550.
Count the tallies:
300–350: 3 (class mark 325)
350–400: 6 (class mark 375)
400–450: 9 (class mark 425)
450–500: 7 (class mark 475)
500–550: 3 (class mark 525)
550–600: 2 (class mark 575)
The total is 30, matching the data. In the diagram above, 400–450 holds 9 of 30 workers, or 30%.
Inclusive version: 300–349, 350–399 and so on give the same frequencies. The gap is 350 − 349 = 1, so subtract and add 0.5: 299.5–349.5, 349.5–399.5, with class marks 324.5, 374.5 and so on.
Loss of information: once grouped, all nine wages in 400–450 are treated as 425. Their actual mean is 3,818 / 9 ≈ 424.2: close, but not equal. NCERT calls this an inherent shortcoming of a frequency distribution.
Practice questions
Continuous or discrete: a baby's weight at birth, the number of rooms in a flat, the time taken to run 100 m? (1 mark each)
Find the class interval and class mark of 120–140. (2 marks)
Make 10–19, 20–29, 30–39 continuous and find the adjusted class marks. (3 marks)
Why are unequal classes preferred for income data? (3 marks)
Re-tally the wage data with a width of 40 starting at 300. How many classes do you get? (4 marks)
Check your answers: Q2 gives 20 and 130; Q3 gives 9.5–19.5, 19.5–29.5, 29.5–39.5 with marks 14.5, 24.5, 34.5; Q5 gives 8 classes.
How many marks is Organisation of Data worth?
The CBSE Economics curriculum for 2026-27 gives 15 marks jointly to Introduction and to Collection, Organisation and Presentation of Data, out of an 80-mark theory paper; there is no separate figure for this chapter. Its syllabus line lists meaning and types of variables, and frequency distribution. The paper weights applying at 30% and analysing, evaluating and creating at 30%, so expect to build tables, not just define terms.
This chapter sits between our guides to collection of data in Class 11 and presentation of data with histograms and ogives. Its closing topic, the bivariate frequency distribution, returns in correlation for Class 11.
Stuck on a step? Fermi's AI tutor is a one-to-one AI tutor that teaches, explains and works through problems alongside the student.