
On this page
Collection of data is where Class 11 Economics turns from definitions to evidence. If you can design a fair survey and explain why one sample beats another, you are ready for this chapter and for your project. This guide follows the official syllabus and the NCERT chapter, with an original school-canteen survey.
What does collection of data cover in the 2026-27 CBSE syllabus?
The CBSE Economics curriculum for 2026-27 places it in Unit 2 of Part A, Statistics for Economics. The unit covers primary and secondary sources, how data are gathered and the idea of sampling, the methods of collection, and two major sources of secondary data: the Census of India and the National Sample Survey Organisation.
The marks table prints a single 15 marks against Introduction and Collection, Organisation and Presentation of Data together, out of 40 for Statistics for Economics. The prescribed book is NCERT's Statistics for Economics; Chapter 2, Collection of Data, is marked "Reprint 2026-27".
What is the difference between primary and secondary data?
Primary data are collected by the researcher through their own enquiry, so they are first-hand information (NCERT, Chapter 2). Secondary data were collected and processed by some other agency, and you find them in published material like government reports, or on websites. The same numbers are primary to whoever collects them first and secondary to everyone who uses them later. Secondary data save time and cost.
NCERT names three ways to collect primary data: personal interviews (allow clarification, cost the most), mailed questionnaires (cheap, but low response rates) and telephone interviews (quicker, but miss people without phones).
How do you design a good questionnaire?
Say you want to know what Class 11 students at your school spend at the canteen each week. Here are five original pairs, each fixing a mistake NCERT warns about.
Leading. Poor: "How much do you enjoy the canteen's delicious samosas?" Good: "How would you rate the canteen's samosas, from 1 (poor) to 5 (very good)?"
Vague. Poor: "Are you a big spender at the canteen?" Good: "Last week, how much did you spend at the canteen? (a) Nothing (b) ₹1-100 (c) ₹101-250 (d) ₹251-400 (e) Over ₹400"
Suggests the answers. Poor: "Do you eat canteen food or skip lunch?" Good: "Where do you usually get your lunch on school days?"
Double negative. Poor: "Wouldn't you not want a fruit counter?" Good: "Would you buy from a fruit counter if the canteen had one? Yes / No"
Wrong order. Poor: opening with "How much pocket money do you get?" Good: start general ("On which days do you usually visit the canteen?") then ask about spending.
The good versions of questions 2 and 4 are closed-ended (multiple choice and two-way), which are easy to score. Open-ended ones are harder to score, so end with one, such as "What one change would you make to the canteen?", then pilot the questionnaire with a few classmates to catch confusing wording.
Census vs sample: which should you use?
A census, or complete enumeration, covers every element of the population; a sample is a smaller group chosen to represent it (NCERT, Chapter 2). NCERT notes that most surveys are sample surveys, because a good sample gives reasonably accurate results at lower cost and in less time.
In random sampling every unit has an equal chance of selection, as in the lottery method. In non-random sampling the investigator's judgement, convenience or a quota decides who is picked.
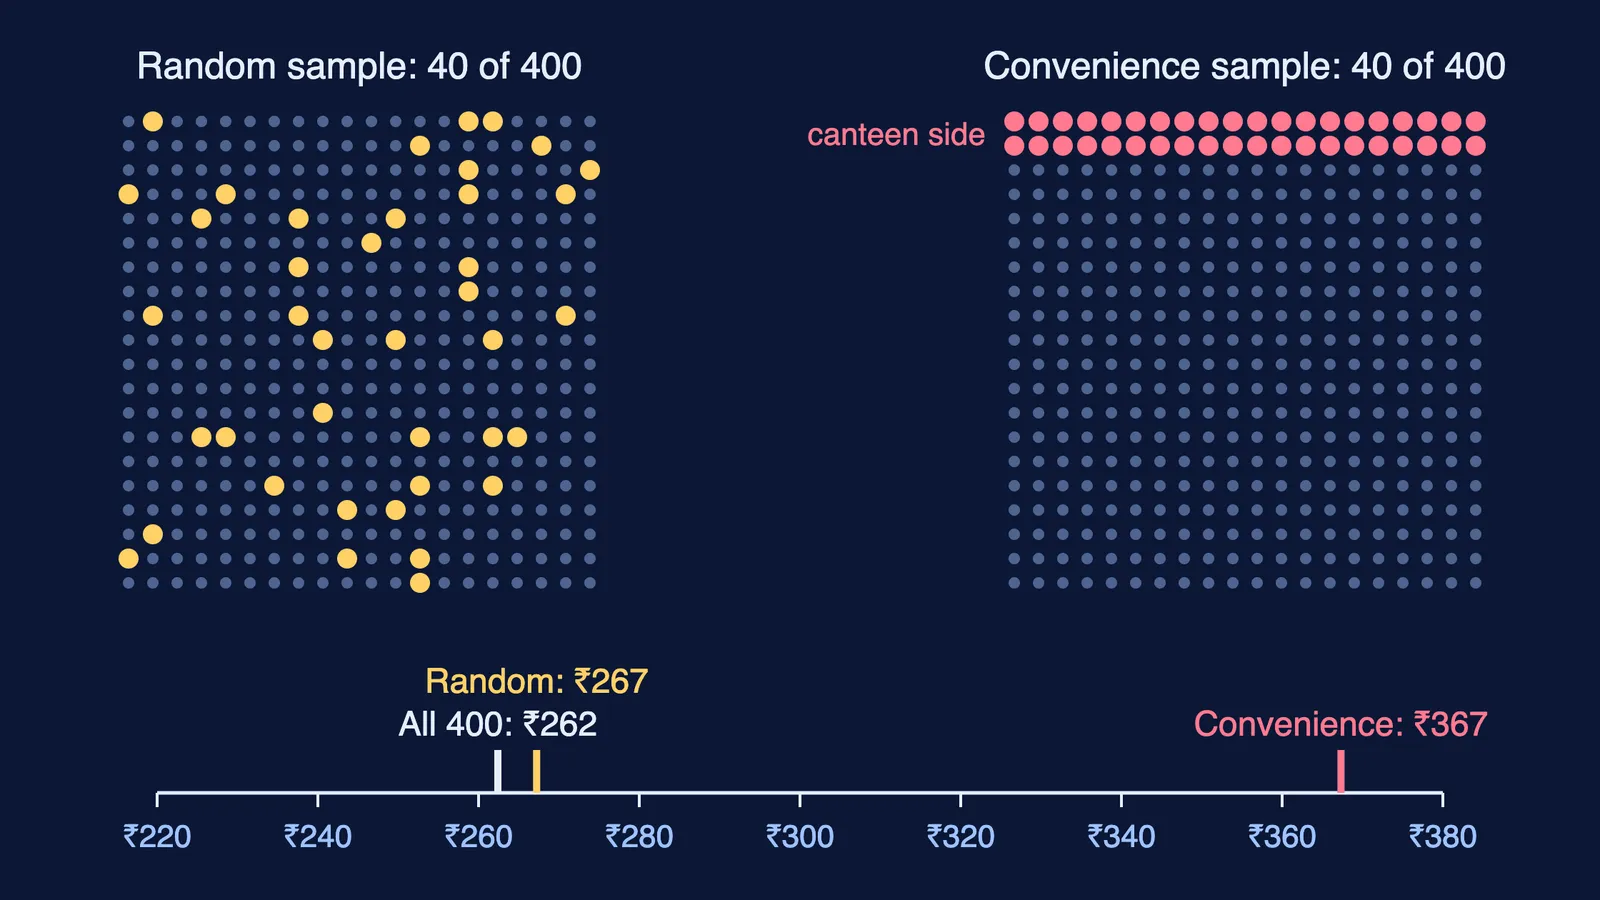
The diagram above shows why this matters. Its numbers are made up: we simulated 400 students in which those near the canteen spend more. All 400 average ₹262 a week. A random sample of 40 averages ₹267. A convenience sample of the 40 students nearest the canteen averages ₹367, more than ₹100 too high. Same sample size; only the selection method changed. That sample is biased: students far from the canteen had no chance of selection, and the heaviest spenders sit nearest it. A bigger sample from the same spot would not fix that.
What are sampling and non-sampling errors?
Sampling error is the difference between a sample estimate and the true population value, and it can be reduced by taking a larger sample (NCERT, Chapter 2). In the canteen example, the true mean (₹262) and the random sample's estimate (₹267) differ by about ₹5, the sampling error.
NCERT treats non-sampling errors as the bigger worry, because they are hard to reduce even with a large sample, and even a census can contain them. They include:
Sampling bias: some members of the population cannot be included, like students who never pass the canteen.
Non-response: selected people cannot be reached or refuse to answer.
Errors in data acquisition: wrong recording, such as writing 13 instead of 31.
The averages you compare here are means, covered in our guide to measures of central tendency for Class 11. If your survey finds spending rising with pocket money, read correlation vs causation with examples before concluding.
Not sure which part to revise first? Fermi's AI tutor can work out what you already know and build a plan for the session, so you sit down to a clear next step.