On this page
Class 11 Statistics for Economics asks you to boil a table of numbers down to one figure, then say what it means. Here are the NCERT formulas for mean, median and mode by series type, with one worked example of each.
What are measures of central tendency in Class 11?
A measure of central tendency summarises data with a single value that can represent the entire data, according to the NCERT Statistics for Economics chapter on measures of central tendency. The chapter covers three averages: arithmetic mean, median and mode.
In the CBSE Class 11 economics curriculum for 2026-27, they sit in Unit 3, Statistical Tools and Interpretation, which carries 25 of the 80 theory marks. The same document says students need to solve the problems and interpret the results, so add a line on what each number means.
What are the formulas for mean, median and mode?
Every formula below follows the NCERT chapter. N is the number of observations, f a frequency, and Σ means add them up.
For an individual series (a plain list):
Mean: X̄ = ΣX / N
Median: arrange in order, then take the size of the (N + 1)/2th item
Mode: the value that occurs most often
For a discrete series (values with frequencies):
Mean: X̄ = ΣfX / Σf
Median: locate the (N + 1)/2th item using cumulative frequency (c.f.)
Mode: the value with the highest frequency
For a continuous series (class intervals):
Mean: X̄ = Σfm / Σf, with m the class mid-point; by step deviation, X̄ = A + (Σfd′ / Σf) × c, where d′ = (m − A)/c
Median: L + [(N/2 − c.f.) / f] × h, where L is the median class's lower limit, c.f. the cumulative frequency before it, f its frequency, h its width
Mode: L + [D1 / (D1 + D2)] × h, where D1 and D2 are the modal class frequency minus the frequencies before and after it
How do you find the mean, median and mode of an individual series?
Seven tea vendors earn Rs 250, 300, 280, 900, 300, 260 and 310 in a day (practice data, NCERT method).
Mean = 2,600 / 7 = Rs 371.43
In order: 250, 260, 280, 300, 300, 310, 900. Median = the 4th item = Rs 300
Mode = Rs 300, the only value appearing twice
One Rs 900 day pulls the mean above what six of the seven earned. NCERT notes the mean is unduly affected by extreme items, so the median describes a typical vendor better.
How do you solve a discrete series?
A momo stall sells 10, 20, 30 or 40 plates an hour, with frequencies 3, 7, 6 and 4 across 20 hours (practice data, NCERT formulas).
ΣfX = 510, so mean = 510 / 20 = 25.5 plates
Cumulative frequencies: 3, 10, 16, 20. The 10.5th item falls in c.f. 16, so median = 30 plates
The highest frequency is 7, so mode = 20 plates
The stall most often sells 20 plates an hour, but half its hours sell 30 or more.
How do you solve a continuous series?
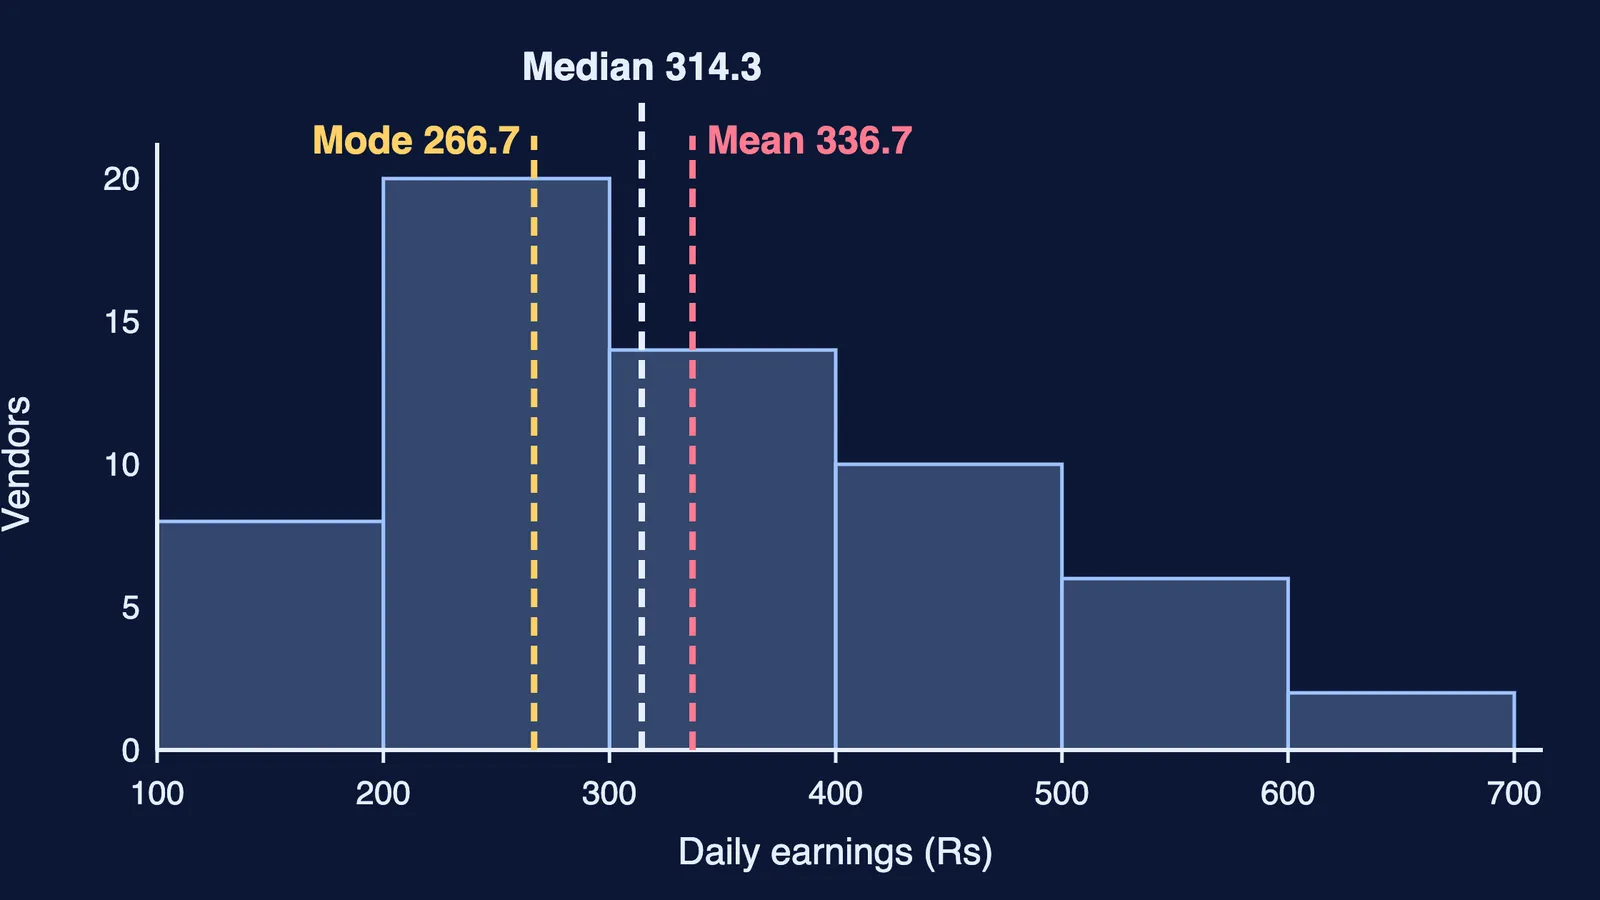
Daily earnings of 60 street vendors (practice data, NCERT formulas); the histogram above is drawn from it. To draw one yourself, see how to turn a grouped frequency table into a histogram.
Rs 100-200: 8
Rs 200-300: 20
Rs 300-400: 14
Rs 400-500: 10
Rs 500-600: 6
Rs 600-700: 2
Mean: mid-points 150 to 650 give Σfm = 20,200, so mean = 20,200 / 60 = Rs 336.67. Step deviation (A = 350, c = 100) gives Σfd′ = −8 and 350 − (8 / 60) × 100 = Rs 336.67
Median: N/2 = 30; cumulative frequencies 8, 28, 42, 52, 58, 60 put it in 300-400. Median = 300 + [(30 − 28) / 14] × 100 = Rs 314.29
Mode: modal class 200-300, D1 = 20 − 8 = 12, D2 = 20 − 14 = 6. Mode = 200 + (12 / 18) × 100 = Rs 266.67
Mode < median < mean: a few high earners stretch the right tail and pull the mean up. NCERT states that the median always lies between the mean and the mode, a quick check on your c.f. column.
Which average should you use?
The NCERT chapter supports these choices:
Extreme values, such as incomes: median
The most demanded shoe size or shirt style: mode
Qualitative data: mode
Open-ended classes: median or mode
Every value matters, no outliers: mean, which uses all observations
If a method keeps going wrong, the Fermi Problem Library has worked problems with a step-by-step solver that explains the reasoning rather than printing an answer, so you can find the step where yours went off.
Next in the same unit is correlation; start with why correlation is not causation.