On this page
You have a grouped frequency table, the class intervals are not all the same size, and you draw each bar as tall as its frequency. It looks right. It is wrong, and it can cost you marks. The fix takes one extra column in your table.
Why do histograms with unequal class widths need adjusting?
In a histogram, the area of each bar stands for the frequency, not just its height. The NCERT Class 9 Statistics chapter puts it directly: in a histogram, "areas of the rectangles erected are proportional to the corresponding frequencies" (NCERT Class 9 Mathematics, Chapter 12, via IIT Kanpur's SATHEE portal).
When every class has the same width, height and area tell the same story, so you can plot frequency on the y-axis. When widths differ, a wide class looks big just because it is wide. A class twice as wide covers twice the range of values, so it will usually hold more of them.
Frequency density is the frequency divided by the class width, as the UK's Oak National Academy lesson on histograms with unequal bar widths defines it. Plot that on the y-axis and the area of each bar, width times height, comes back to the frequency.
How do you calculate the adjusted frequency for each class?
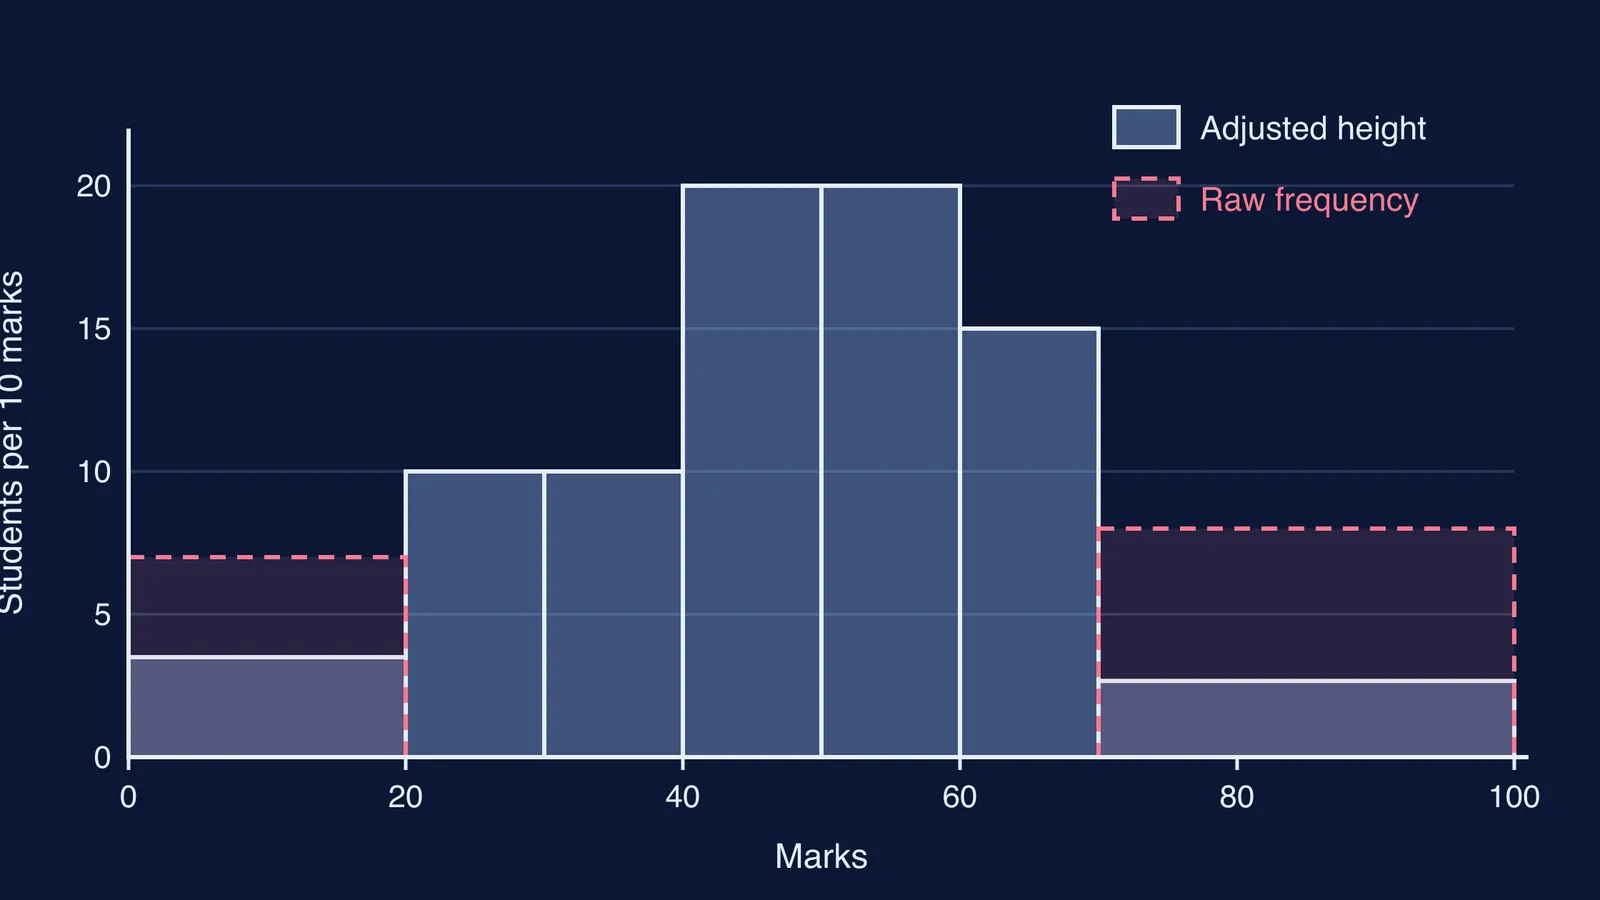
NCERT uses a slightly different version that gives friendlier numbers: pick the smallest class width and scale every height to it. Its example is the marks of 90 students in the NCERT Class 9 Statistics chapter, where the minimum class size is 10.
The rule is: adjusted height = (frequency ÷ class width) × minimum class width.
Here is the full working for NCERT's data:
0-20, width 20, frequency 7: 7/20 × 10 = 3.5
20-30, width 10, frequency 10: 10/10 × 10 = 10
30-40, width 10, frequency 10: 10
40-50, width 10, frequency 20: 20
50-60, width 10, frequency 20: 20
60-70, width 10, frequency 15: 15
70-100, width 30, frequency 8: 8/30 × 10 = 2.67 (rounded)
Label the y-axis with what the heights mean, such as "students per 10 marks", not "number of students". NCERT calls these heights the "proportion of students per 10 marks interval".
Both methods draw the same shape. Dividing only by the width gives heights of 0.35, 1, 1, 2, 2, 1.5 and about 0.27 students per mark. NCERT's version multiplies all of them by 10. Use whichever your teacher uses, and say on the axis which one it is.
What goes wrong if you plot raw frequency?
Try it with the same NCERT marks data. If you draw the 70-100 bar 8 units tall, it is 30 marks wide, so its area is 8 × 30 = 240. The 40-50 bar, 20 tall and 10 wide, has an area of 200. Your picture now says more students scored 70-100 than 40-50, when the table says 8 against 20.
The 0-20 bar has the same problem in a smaller way. It is drawn twice as tall as it should be, so the weakest scores look more common than they are.
If you can't see why area carries the meaning, our post on bar graphs vs histograms walks through why histograms have no gaps and why width matters. The Fermi Concept Library has a lesson for each concept in mathematics, so you can go back to class width and continuous data before you try again.
What should you check before drawing the bars?
Run through this for any histogram question:
Check the classes are continuous. If they read 10-19, 20-29, convert them first using the 0.5 rule for inclusive class intervals.
Add a "class width" column and check whether the widths are equal.
If they are not, add an "adjusted height" or "frequency density" column and fill it in.
Label the y-axis with what you actually plotted.
Check one bar: width × height should give back the frequency (or the frequency × 10, in NCERT's version).
If you are later asked for a frequency polygon, join the midpoints of the tops of the adjusted bars. Our guide to drawing a frequency polygon from a histogram covers the remaining steps.
Textbook editions change, so check which version of the chapter your school uses. The rule itself stays the same: area shows frequency. To practise, work through problems in the Fermi Problem Library, where a step-by-step solver explains the reasoning rather than just printing an answer.