

On this page
When working with grouped data in statistics, class intervals often come in two forms. In an exclusive (or continuous) series like 10–20, 20–30, the upper limit of one class is the exact starting point of the next. But sometimes, data is presented in an inclusive form, such as 10–19, 20–29, leaving a gap between the groups.
If you are just finding the mean, that gap does not matter because the class midpoint stays the same as shown in NCERT rules. However, if you need to calculate the median or mode, the formulas rely on a continuous boundary. To use those formulas correctly, you must convert the inclusive intervals into continuous ones first.
How to convert inclusive class intervals to continuous?
The standard method, taught in NCERT Class 10 mathematics, uses a correction factor to bridge the gap between adjacent classes.
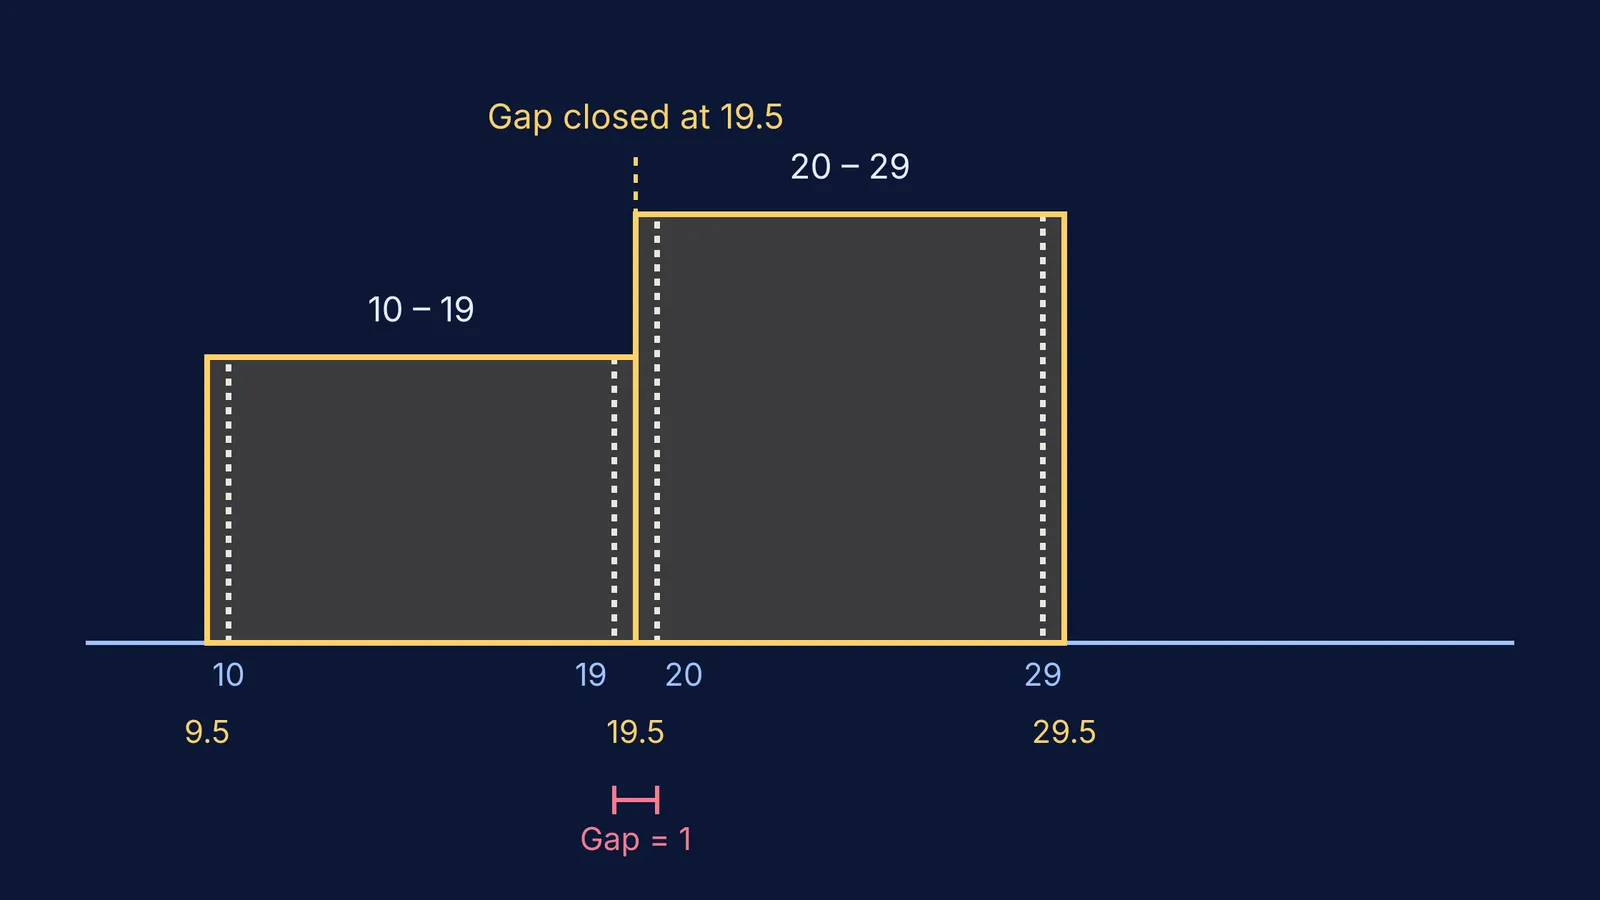
Find the gap: Subtract the upper limit of the first class from the lower limit of the next class. For intervals 10–19 and 20–29, the gap is 20 − 19 = 1.
Calculate the correction factor: Divide that gap by 2 (1 ÷ 2 = 0.5).
Adjust the limits: Subtract 0.5 from every lower limit, and add 0.5 to every upper limit.
For example, an inclusive class of 10–19 becomes 9.5–19.5. The next class, 20–29, becomes 19.5–29.5. The gap is gone, and the upper limit of one group now perfectly matches the lower limit of the next.
Why must you convert intervals for median and mode?
The formulas for the median and mode of grouped data both require two specific values: the lower limit (l) of a specific class, and the class size (h).
For the median, the formula is l + [(n/2 − cf) / f] × h. For the mode, it is l + [(f₁ − f₀) / (2f₁ − f₀ − f₂)] × h.
These formulas were derived assuming that data is plotted on a continuous number line—just like when drawing a histogram. If you use the inclusive limits, you introduce two errors:
Your lower limit (l) will be too high by 0.5.
Your class size (h) will be too small (for 10–19, h looks like 9, but in the continuous 9.5–19.5, h is correctly 10).
This precision is especially important for advanced topics, such as calculating the mean absolute deviation about the median. Using unconverted inclusive intervals will give you an incorrect final answer in your exams.
If you have gaps in your foundation and often forget rules like this, the Fermi Concept Library has a lesson for every concept in mathematics, each with its place in the map, to help you understand why formulas work.
What if the gap is not 1?
While most textbook problems have a gap of exactly 1, real-world data might have different gaps. The rule of dividing the gap by 2 still applies perfectly.
For instance, if you are measuring weights and your intervals are 10.0–19.8 and 20.0–29.8, the gap between 19.8 and 20.0 is 0.2.
Find the gap: 20.0 − 19.8 = 0.2.
Calculate the correction factor: 0.2 ÷ 2 = 0.1.
Adjust the limits: Subtract 0.1 from the lower limits and add 0.1 to the upper limits.
Your new continuous interval becomes 9.9–19.9, and the next one becomes 19.9–29.9. The logic remains identical: find the space between the groups and split it evenly to meet in the middle.
Does the conversion change the mean?
No. The mean depends on the class mark, which is the midpoint of the interval.
For the inclusive class 10–19, the class mark is (10 + 19) / 2 = 14.5. For the converted continuous class 9.5–19.5, the class mark is (9.5 + 19.5) / 2 = 14.5.
Because the midpoint stays exactly the same, calculating the mean of an inclusive series will give you the same result whether you convert it or not. However, converting it is a good habit to prevent mistakes if a question asks for both the mean and the median.
Worked example: Finding the median of inclusive data
Suppose you are given this frequency distribution and asked to find the median:
11–20: frequency 3
21–30: frequency 5
31–40: frequency 2
Step 1: Convert to continuous. Apply the 0.5 adjustment.
10.5–20.5: 3
20.5–30.5: 5
30.5–40.5: 2
Step 2: Find cumulative frequencies (cf).
10.5–20.5: 3
20.5–30.5: 8 (this is 3 + 5)
30.5–40.5: 10 (this is 8 + 2)
Step 3: Identify the median class. Here, n = 10, so n/2 = 5. The cumulative frequency just greater than 5 is 8, which corresponds to the class 20.5–30.5.
Step 4: Apply the median formula.
Lower limit (l) = 20.5
Class size (h) = 10
Frequency (f) = 5
Cumulative frequency of previous class (cf) = 3
Median = 20.5 + [(5 − 3) / 5] × 10 Median = 20.5 + (2 / 5) × 10 Median = 20.5 + 4 = 24.5.
If you need an AI tutor to work through problems alongside you and catch mistakes like forgetting a conversion, the Fermi Problem Library has worked problems with a step-by-step solver that explains the reasoning rather than printing an answer.
Knowing when to adjust your data is the first step to understanding statistics.


