
On this page
Correlation is where Class 11 Economics starts asking how two variables move together. Here is what the 2026-27 CBSE syllabus keeps, one original calculation done both ways, and the slips that cost marks.
What does the 2026-27 CBSE syllabus include for correlation?
The CBSE Economics curriculum for 2026-27 lists correlation under Unit 3, Statistical Tools and Interpretation, in Part A, Statistics for Economics. The syllabus line reads: "Correlation – meaning and properties, scatter diagram; measures of correlation - Karl Pearson's method (two variables ungrouped data) Spearman's rank correlation (Non-Repeated Ranks and Repeated Ranks)."
That unit carries 25 marks in the Class XI marks table of the same CBSE curriculum document, and it shares them with measures of central tendency and index numbers. The curriculum also asks for an economic interpretation of every numerical result, so a bare r is not a full answer.
Your textbook is Chapter 6 of NCERT's Statistics for Economics, marked "Reprint 2026-27".
What is correlation, and what does a scatter diagram show?
In NCERT's framing, correlation tells you two things about how variables are related: which way they move (direction) and how closely (intensity) (NCERT Chapter 6).
Positive: both move the same way, like income and consumption.
Negative: they move in opposite directions, like the price of apples and demand for them.
None: the points show no upward or downward line.
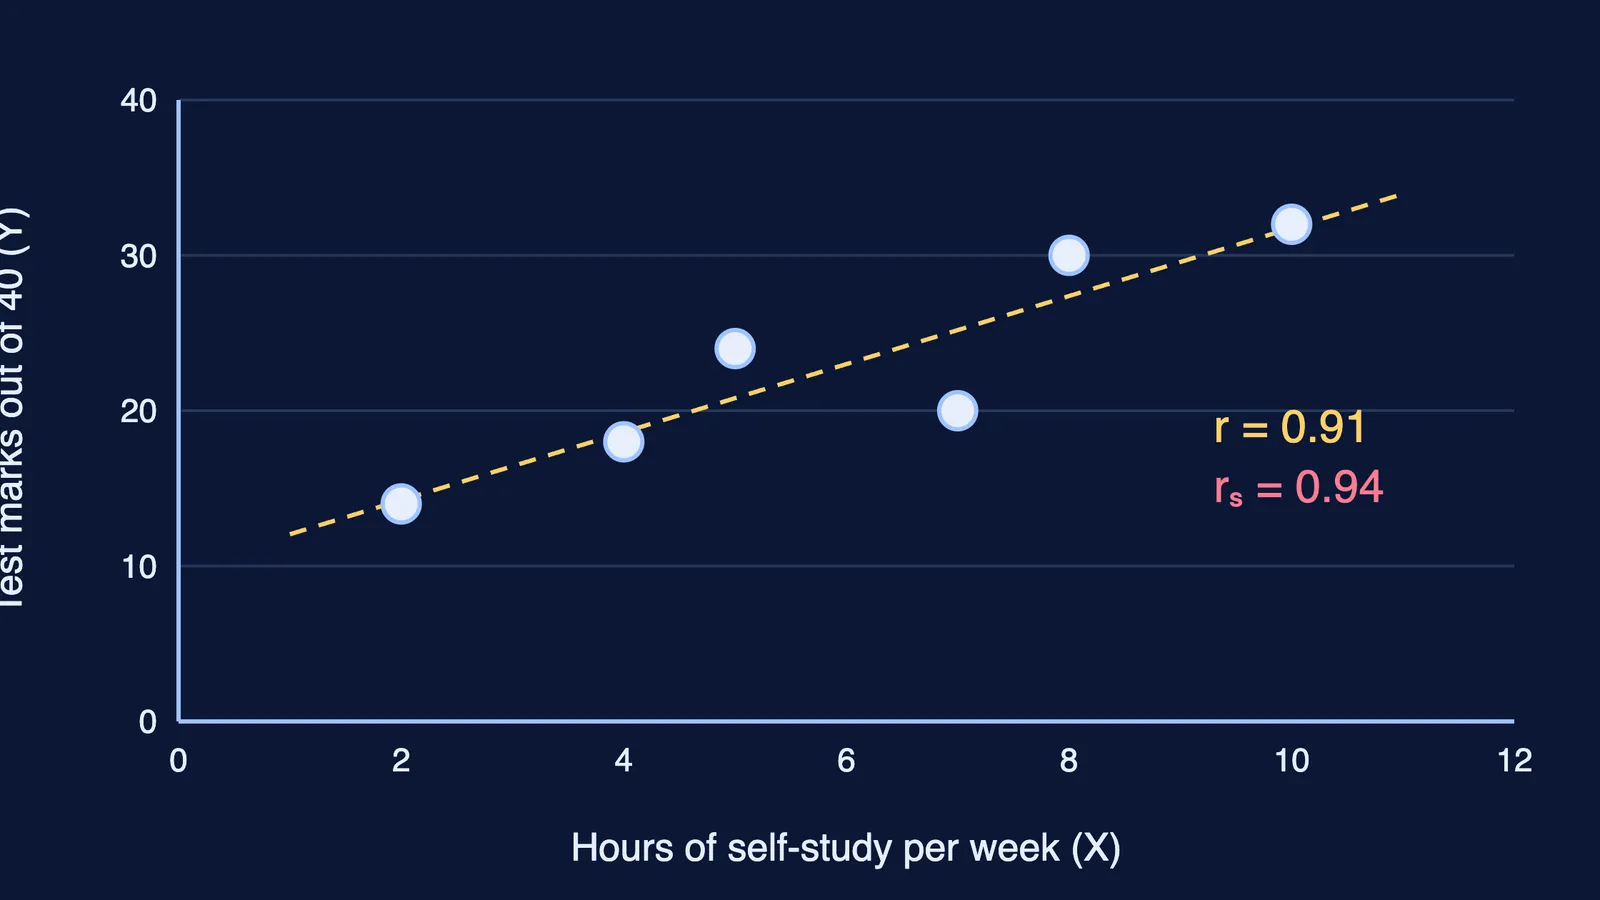
A scatter diagram plots each pair as a point. When every point sits exactly on a straight line, r is +1 or −1; the more the points spread away from a line, the weaker the relationship. NCERT advises looking at the scatter first, since Karl Pearson's r is meant for straight-line relationships only.
How do you calculate Karl Pearson's coefficient?
Here is an original data set, not from NCERT. Six students record weekly self-study hours (X) and unit-test marks out of 40 (Y):
X: 2, 4, 5, 7, 8, 10
Y: 14, 18, 24, 20, 30, 32
Step 1, the means. ΣX = 36, so the mean of X is 6. ΣY = 138, so the mean of Y is 23.
Step 2, deviations from the mean, x = X − 6 and y = Y − 23:
x: −4, −2, −1, 1, 2, 4
y: −9, −5, 1, −3, 7, 9
Step 3, sums. Σxy = 36 + 10 − 1 − 3 + 14 + 36 = 92. Σx² = 16 + 4 + 1 + 1 + 4 + 16 = 42. Σy² = 81 + 25 + 1 + 9 + 49 + 81 = 246.
Step 4, the formula r = Σxy ÷ √(Σx² × Σy²):
r = 92 ÷ √(42 × 246) = 92 ÷ √10,332 = 92 ÷ 101.65 ≈ 0.91
The direct formula (ΣXY = 920, ΣX² = 258, ΣY² = 3,420, N = 6) gives the same 0.91.
Interpretation, which CBSE expects: study hours and test marks have a high positive correlation in this group. It does not prove extra hours caused higher marks; interest could drive both, as our guide to correlation vs causation explains.
How do you calculate Spearman's rank correlation?
Spearman's coefficient uses ranks, not values, so it suits data that can only be ranked or has extreme values. The formula is rₛ = 1 − 6ΣD² ÷ (n³ − n), where D is the difference between the two ranks of each item (NCERT Chapter 6).
Rank the same six students, rank 1 for the highest value:
Rank by hours: 6, 5, 4, 3, 2, 1
Rank by marks: 6, 5, 3, 4, 2, 1
D: 0, 0, 1, −1, 0, 0
ΣD² = 2, so rₛ = 1 − (6 × 2) ÷ (216 − 6) = 1 − 12 ÷ 210 ≈ 0.94.
Both methods show a strong positive relationship. Spearman is a little higher because only order matters: the student with 7 hours and 20 marks drops one place, but how far 20 sits below the trend no longer counts.
Repeated ranks. Tied values each take the average of the ranks they would have held, so a tie for 3rd and 4th gives both 3.5. For each tie, add (m³ − m) ÷ 12 to ΣD², where m is the number of tied items; for a pair, (8 − 2) ÷ 12 = 0.5.
What mistakes cost marks in correlation questions?
Wrong denominator. Spearman uses n³ − n, not n² − 1.
Ranking in opposite directions. Rank both variables highest-first, or both lowest-first, or the sign flips.
Not checking ΣD = 0. If it is not zero, a rank is wrong.
Skipping the tie correction. The syllabus names repeated ranks, so expect one.
Answers outside −1 to +1. NCERT says that signals a calculation error.
No interpretation. End with one sentence on direction and strength in context, and never claim cause.
If method errors keep costing you marks, the Fermi Problem Library has worked problems with a step-by-step solver that explains the reasoning rather than printing an answer.
Next, build your own six-pair data set and work it both ways.