On this page
In Class 11 Statistics for Economics, organising and presenting data turns raw numbers into a table and a picture. Marks slip on small things: a boundary value counted twice, gaps between histogram bars. Here is what the 2026-27 syllabus keeps, and one original data set worked from raw numbers to a median read off two ogives.
What does the 2026-27 CBSE syllabus include?
The CBSE Economics curriculum for 2026-27 lists Organisation of Data as "Meaning and types of variables; Frequency Distribution". Presentation of Data covers tables plus three kinds of diagram:
Geometric forms: bar and pie diagrams
Frequency diagrams: histogram, polygon and ogive
Arithmetic line graphs (time series graph)
In its Class XI marks table, "Introduction" and "Collection, Organisation and Presentation of Data" share one cell: 15 marks of the 80-mark theory paper. The matching NCERT chapters are Organisation of Data (Chapter 3) and Presentation of Data (Chapter 4) of Statistics for Economics, Reprint 2026-27.
How do you make a frequency distribution?
NCERT Chapter 3 describes a frequency distribution as a summary that sorts the raw values of a quantitative variable into classes and records how many values fall in each one (the class frequency). The class mark is (upper class limit + lower class limit) / 2, and in exclusive classes a value equal to a class limit goes into only one class.
Our own data set, made up for this post: monthly electricity bills (Rs) of 40 households in one colony.
640, 910, 1180, 455, 780, 1020, 600, 870, 1310, 720, 515, 980, 845, 1100, 690, 260, 1000, 760, 935, 580, 1250, 820, 705, 1060, 395, 880, 960, 650, 1140, 800, 530, 1375, 740, 990, 860, 345, 1210, 615, 905, 775
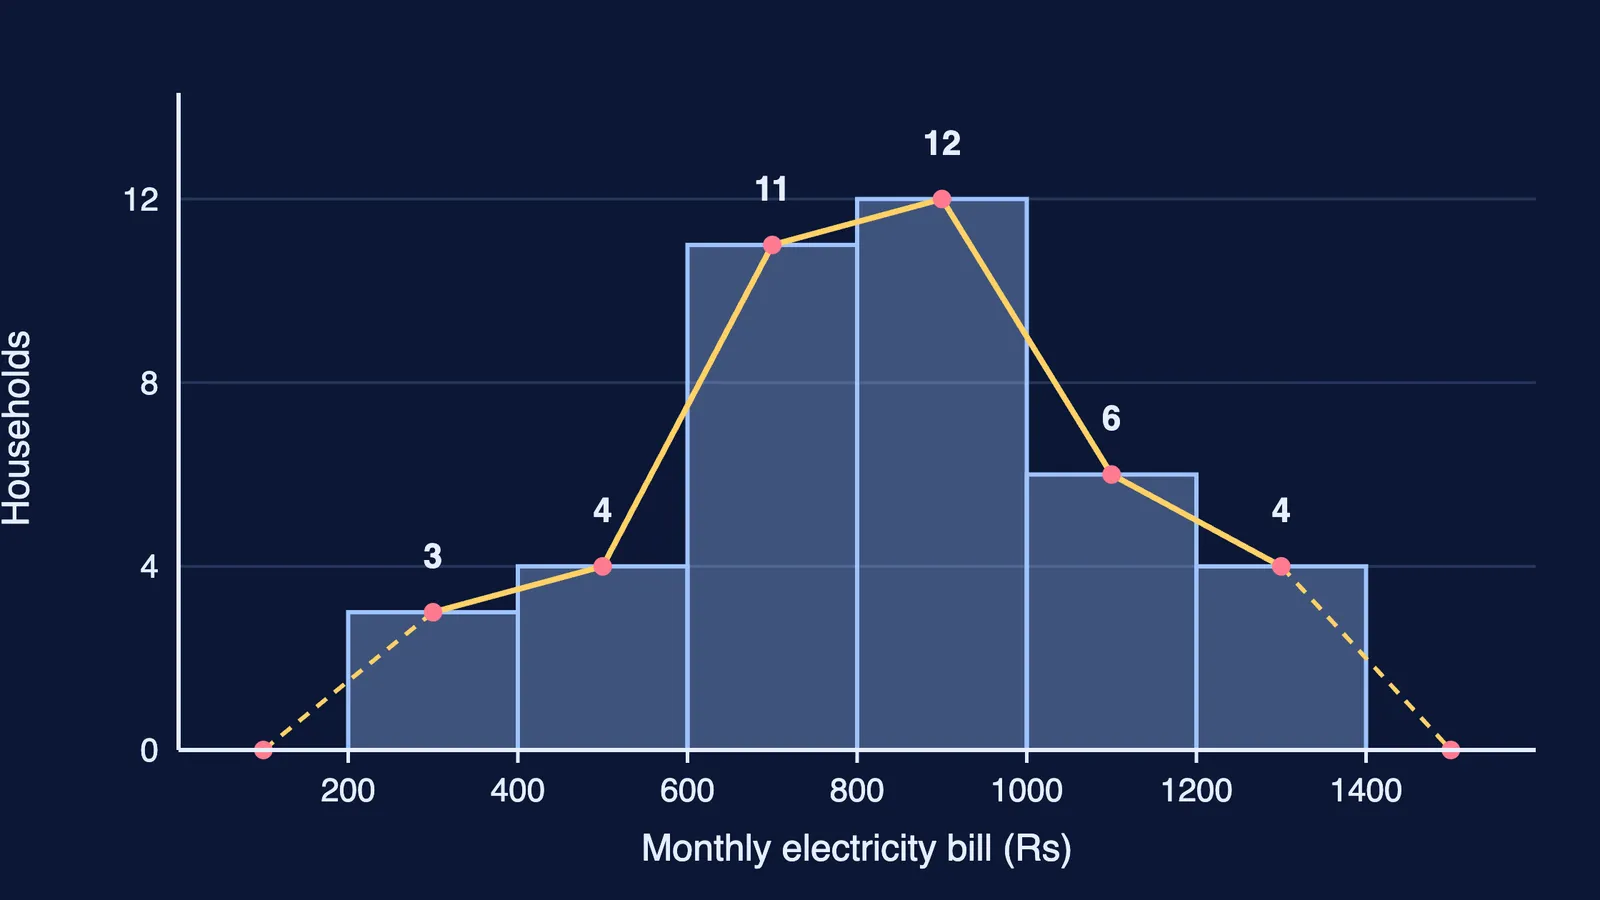
Bills run from 260 to 1,375, so six exclusive classes of width 200, from 200 to 1,400, cover them. Tally each value; a bill of exactly 600, 800 or 1,000 goes in the class that starts there:
200–400: 3 households
400–600: 4
600–800: 11
800–1000: 12
1000–1200: 6
1200–1400: 4
The total is 40: your first check.
What are the parts of a good table?
NCERT Chapter 4 lists eight parts: table number, title, captions (column headings), stubs (row headings), body, unit of measurement, source and note. For our data: title "Monthly electricity bills of 40 households", unit Rs, source hypothetical data.
Histogram vs bar diagram: what is the difference?
NCERT Chapter 4 sets out the differences:
Histogram rectangles touch, with no space between them; bar diagram bars must have gaps (except multiple or component bars).
In a histogram the width matters as much as the height, because area is proportional to frequency; in a bar diagram only the height matters.
Bar diagrams suit discrete or continuous variables; histograms only continuous ones.
With unequal class widths, plot frequency density (frequency divided by class width), not frequency.
The image above is our histogram. For the frequency polygon, plot each frequency at its class mark (300, 500 and so on up to 1,300) at heights 3, 4, 11, 12, 6 and 4, join them, and bring each end down to the baseline at the mid-value of the empty class on either side: 100 and 1,500. The area under it then represents the total frequency, as the histogram does.
How do you draw ogives and find the median?
An ogive is a cumulative frequency curve. NCERT plots the "less than" ogive against upper class limits and the "more than" ogive against lower limits, and notes that the two cross at the median.
Less than: 400 → 3, 600 → 7, 800 → 18, 1000 → 30, 1200 → 36, 1400 → 40.
More than: 200 → 40, 400 → 37, 600 → 33, 800 → 22, 1000 → 10, 1200 → 4.
Between 800 and 1,000 the less-than line rises from 18 to 30 and the more-than line falls from 22 to 10. They meet at a height of 20 (half of 40), at Rs 833.33.
Check it with the grouped median formula: L + ((N/2 − cf) / f) × h = 800 + ((20 − 18) / 12) × 200 = 833.33. The median of the 40 raw bills is (820 + 845) / 2 = 832.50. The gap is the loss of information NCERT Chapter 3 describes: grouped data no longer carry the individual values.
What should you practise next?
Redraw this set with classes of 300 to see the shape change. Our guide to mean, median and mode for Class 11 uses grouped data like this; index numbers for Class 11 is also in Unit 3. If a cumulative-frequency step keeps going wrong, the Fermi Problem Library has worked problems with a step-by-step solver that explains the reasoning rather than printing an answer.