
On this page
This glossary follows Chapter 7, "The Mathematics of Maybe: Introduction to Probability", of the new NCERT Class 9 Mathematics textbook Ganita Manjari, Part I, and the Introduction to Probability unit of the CBSE Class IX Mathematics curriculum for 2026-27, which lists randomness, the probability scale, empirical probability (the book calls it experimental probability), theoretical probability with sample space and events, and tree diagrams and tables. Definitions are in our own words. For the full chapter walk-through, read our Mathematics of Maybe Class 9 chapter guide.
What is probability, and what makes something random?
Probability: a number that measures how likely an event is. Example: the probability of heads on a fair coin is 1/2.
Randomness: the possible results are all known, yet the result of any one try cannot be predicted. Example: one roll of a die.
Random event: an event whose possible results are known but whose actual result is not known in advance. Example: whether it rains today.
Random experiment (random observation): a repeatable action whose result can change from try to try and is unknown beforehand. Example: tossing a coin.
Subjective probability: a likelihood judged from how one person reads the evidence, not from counting. Example: "The sun is shining, so rain is unlikely." Don't confuse with: the objective estimates the rest of the chapter teaches.
Fair (unbiased): a coin or die shaped evenly, so no side is favoured. In a random toss, nothing interferes with how the coin lands.
How does the probability scale work?
Probability scale: a line from 0 to 1 on which every probability sits; P(E), the probability of event E, always satisfies 0 ≤ P(E) ≤ 1. Example: 0.75 means a 75% chance.
Impossible: probability 0. Example: a number greater than 6 on a standard die.
Certain: probability 1. Example: a red sweet from a bag of only red sweets.
Even chance (equally likely): probability 0.5. Example: heads on a fair coin.
Less likely and more likely: below 0.5 and above 0.5. Example: rolling a 3 (1/6) is less likely; drawing a number card from 2 to 10 out of 52 cards (36/52) is more likely.
What is the difference between experimental and theoretical probability?
Trial: one go of an experiment. Example: each of 50 rolls of a die is a trial.
Experimental probability: times the event happened divided by total trials. Example: a 4 came up 8 times in 50 rolls, so 8/50 = 0.16.
Relative frequency: that same ratio from observed data. Don't confuse with: frequency, the count itself (8).
Statistical probability: experimental probability from collected data, such as a survey. Example: 20 of 50 students prefer mango, so 20/50 = 0.4.
Population and sample: the population is the whole group; the sample is the part you actually ask. Example: 50 students in one class out of a school of 1500.
Sampling: choosing which part of the population to collect data from. Example: 0.4 × 1500 suggests about 600 mangoes; a larger sample from several classes is more trustworthy.
Theoretical probability: the number of favourable outcomes divided by the number of possible outcomes, used only when every outcome is equally likely. Example: P(B from the letters of PROBABILITY) = 2/11.
Favourable outcomes: the outcomes that make the event happen. Example: for "an even number on a die", 2, 4 and 6, so the probability is 3/6 = 1/2.
Law of Large Numbers: the more trials you run, the nearer experimental probability tends to come to theoretical probability. Example: three 3s in 12 rolls gives 0.25, but over thousands of rolls the fraction tends to settle near 1/6.
Independent events: results that do not affect each other. Example: rolls in Snakes and Ladders.
Gambler's fallacy: the mistaken belief that after a run of one result, a different result is "due". Don't confuse with: the Law of Large Numbers, which is about the long run, not the next roll.
How do you write a sample space and an event?
Outcome: one possible result of an experiment. Example: T on a coin.
Sample space (S): the set of all possible outcomes, written in braces, with nothing missing and nothing repeated. Example: one die gives S = {1, 2, 3, 4, 5, 6}. Counter-example: for the number of heads in three coin tosses, {1, 2, 3} fails because 0 is missing.
Element: each outcome listed in S.
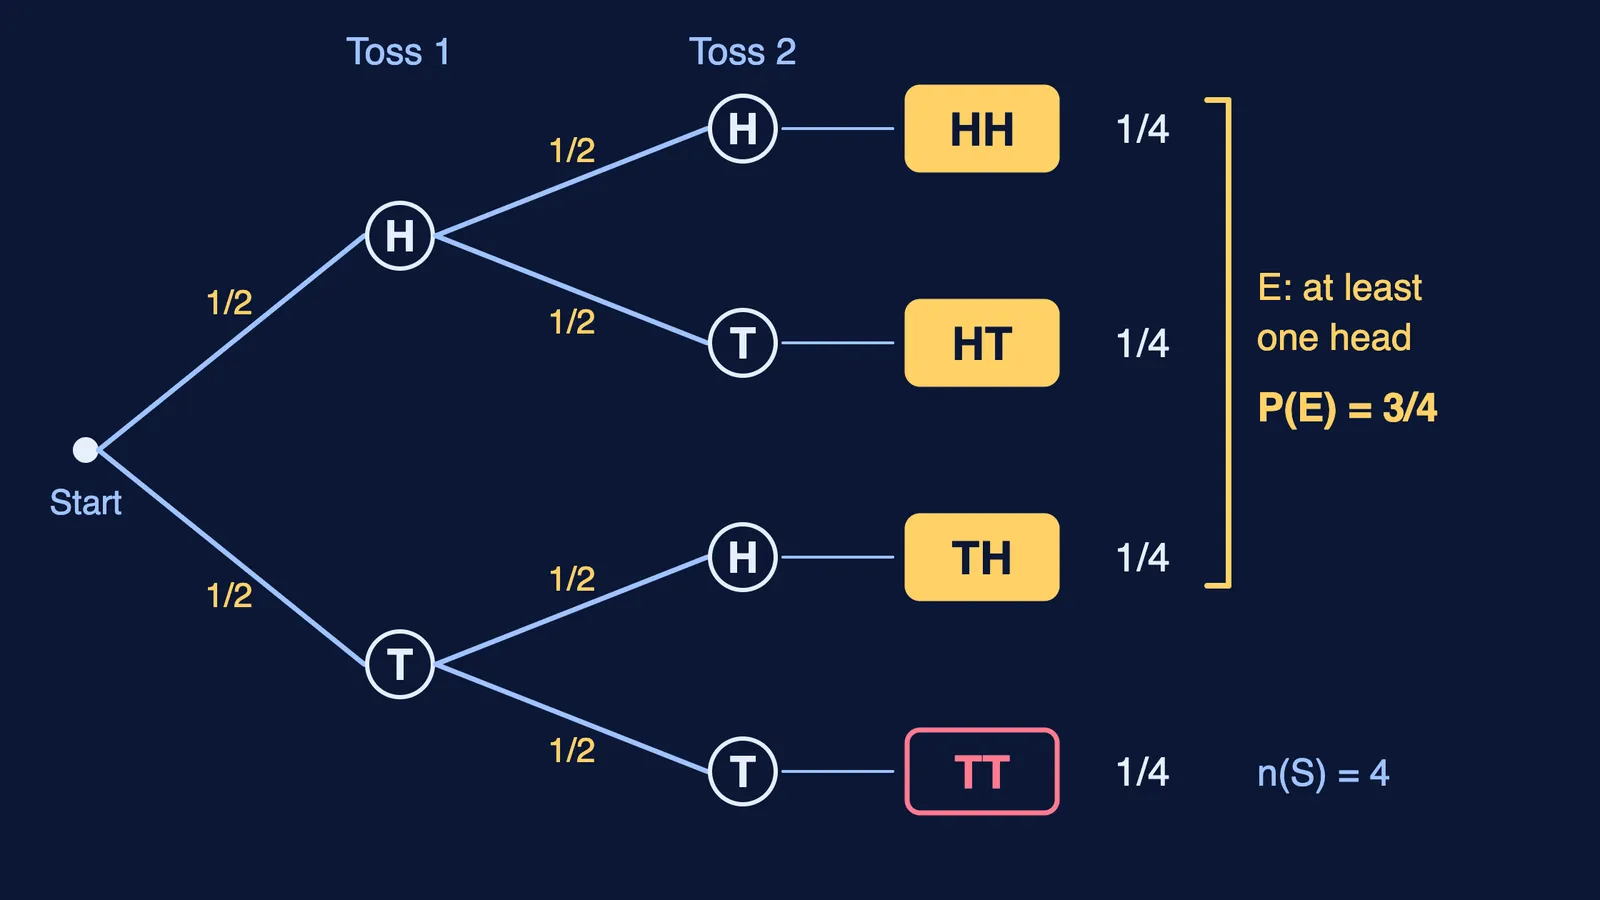
Sample size, n(S): the number of elements in S. Example: tossing two coins gives S = {HH, HT, TH, TT}, so n(S) = 4.
Event (E): any single outcome or group of outcomes; in set terms, a subset of S. Example: "greater than 4" on a die is E = {5, 6}, so P(E) = 2/6 = 1/3. Don't confuse with: an outcome, which is always just one result.
How do tree diagrams and tables list outcomes?
Multi-step experiment: two or more independent trials done one after another. Example: tossing a coin twice. Don't confuse with: a single-step experiment, such as one roll of a die.
Tree diagram: a picture whose branches split at each step, so following one route to its end gives one full outcome. Example: two tosses give four routes, HH, HT, TH and TT, and P(HH) = 1/4.
Table of outcomes: rows and columns pairing each first result with each second. Example: 2 shirts and 3 pairs of pants give 2 × 3 = 6 outfits.
This chapter does not define complementary or mutually exclusive events; for those, see our guide to sample space and types of events in Class 11.
How to learn these terms
Learn the pairs together: experimental and theoretical, frequency and relative frequency, outcome and event.
Write S in braces before any division, then check that nothing is missing or repeated.
Roll a die 30 times, find the experimental probability of a 6, then pool class results; the combined fraction tends to move closer to 1/6.
Draw a tree for every two-step question.
Check every answer lies between 0 and 1.
If a term still feels unclear, the Fermi Concept Library gives each concept in mathematics its own lesson. To see these traps in harder questions, read five common probability reasoning mistakes and their fixes.