
On this page
Market Equilibrium is Chapter 5 of the NCERT book Introductory Microeconomics (Reprint 2026-27), which CBSE teaches in Class 11. It asks one question: at what price do buyers' plans and sellers' plans match? Answer that with a diagram and every shift, ceiling and floor question follows.
What is market equilibrium in Class 11 economics?
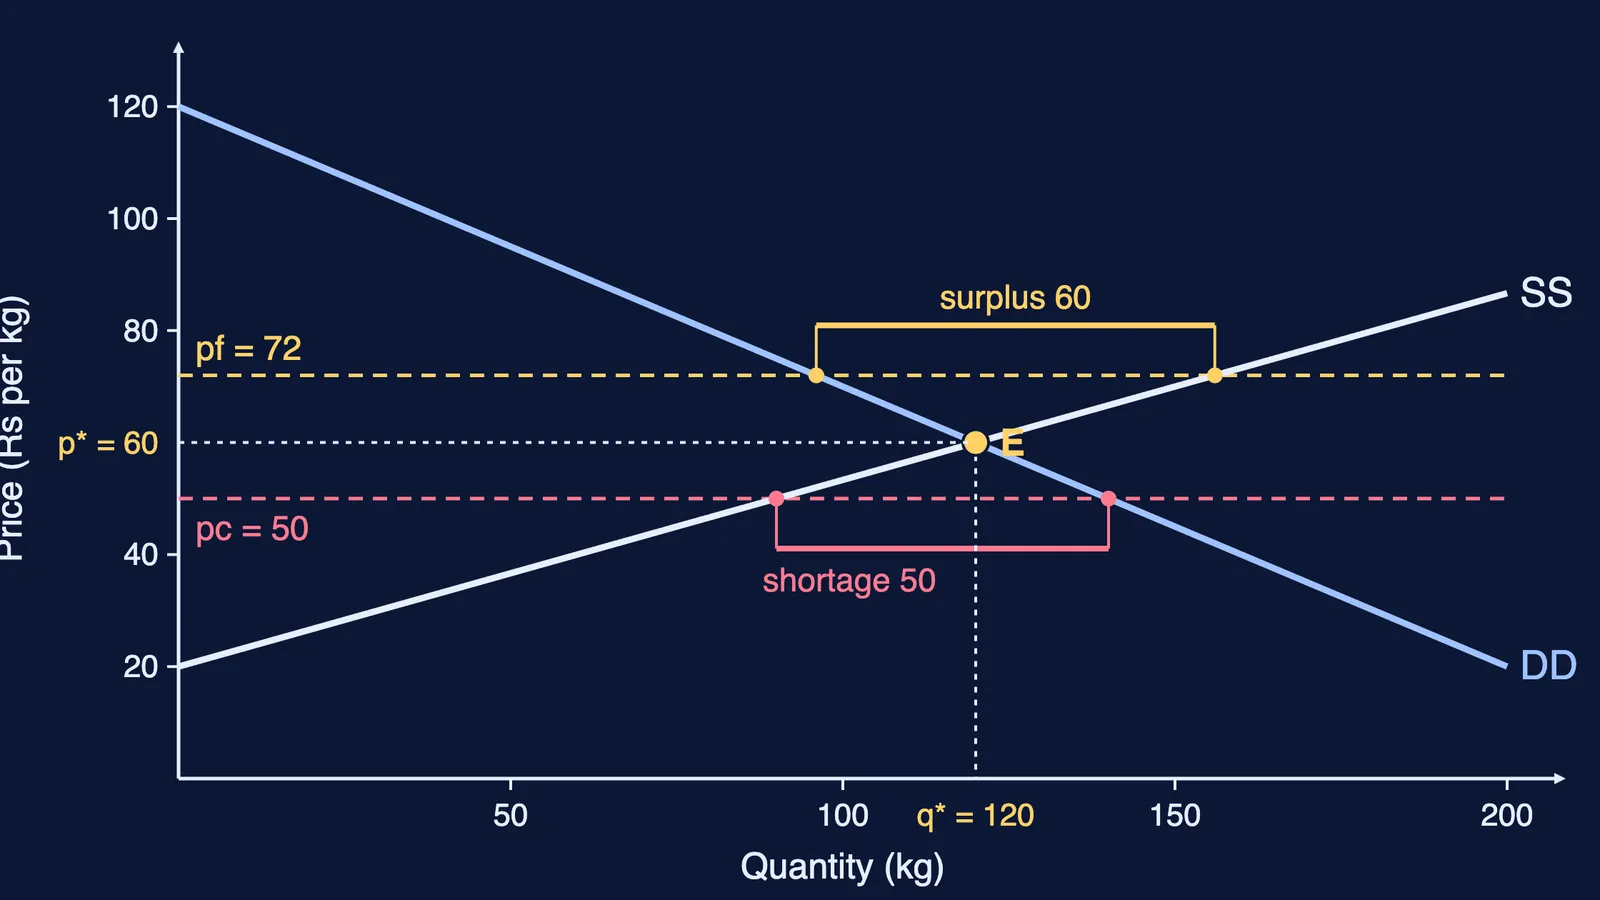
Equilibrium is the situation where market demand equals market supply, so the market clears; NCERT writes the condition as qD(p*) = qS(p*) in its Market Equilibrium chapter. p* is the equilibrium price and q* the equilibrium quantity.
Excess demand: below p*, demand exceeds supply, so price tends to rise.
Excess supply: above p*, supply exceeds demand, so price tends to fall.
NCERT calls this adjustment the "Invisible Hand" and assumes it always reaches equilibrium.
In the CBSE Economics curriculum 2026-27, this chapter sits in the unit "Forms of Market and Price Determination under perfect competition with simple applications", which carries 08 marks. That mark covers the whole unit. The curriculum limits the topic to the short run, so NCERT's section 5.1.2 on free entry and exit is outside your syllabus. The chapter's wage-determination box is not named in the unit either; ask your teacher before skipping it.
Worked example: finding equilibrium price and quantity
An imaginary rice market (kg, Rs per kg):
qD = 240 − 2p
qS = 3p − 60 for p ≥ 20, and qS = 0 for p < 20
Set qD = qS: 240 − 2p = 3p − 60.
So 300 = 5p and p* = Rs 60 per kg.
Substitute: q* = 240 − 2(60) = 120 kg. Check with supply: 3(60) − 60 = 120 kg.
At Rs 50, qD = 140 and qS = 90, so there is excess demand of 50 kg. At Rs 72, qD = 96 and qS = 156, so there is excess supply of 60 kg. Always put p* back into both equations; if the quantities differ, you have an algebra slip.
What happens when demand or supply shifts?
With a fixed number of firms, the NCERT chapter gives four results:
Demand shifts right: price and quantity rise (say, incomes rise for a normal good).
Demand shifts left: both fall.
Supply shifts right: price falls, quantity rises (say, the number of firms rises).
Supply shifts left: price rises, quantity falls (say, an input gets costlier).
Worked shift. If incomes rise and rice is a normal good, demand might become qD = 290 − 2p, with supply unchanged. At the old price of Rs 60, demand is 170 kg against supply of 120 kg, an excess demand of 50 kg. Solving 290 − 2p = 3p − 60 gives p = Rs 70 and q = 150 kg.
When both curves shift, one effect is certain and the other depends on the sizes of the shifts:
Same direction: quantity is certain; price may rise, fall or stay the same.
Opposite directions: price is certain; quantity may rise, fall or stay the same.
For what moves each curve, see our law of demand Class 11 guide and law of supply Class 11 guide.
How do a price ceiling and a price floor work?
A price ceiling is a government-set maximum price, fixed below equilibrium for necessities; a price floor is a government-set minimum price, fixed above equilibrium, as described in the NCERT chapter.
Ceiling: in our rice market, a ceiling of Rs 50 creates a shortage of 140 − 90 = 50 kg. NCERT links this to rationing through fair price shops, long queues and a possible black market.
Floor: a floor of Rs 72 creates a surplus of 156 − 96 = 60 kg. NCERT's examples are agricultural price support and minimum wages; under price support, the government buys the surplus.
Our price ceiling and price floor Class 11 guide goes deeper.
How to prepare: practice questions
The curriculum's question paper design for Class 11 gives 32 marks (40%) to remembering and understanding, 24 marks (30%) to applying, and 24 marks (30%) to analysing, evaluating and creating. Try these original questions (CBSE publishes no Class 11 sample paper, so the marks are our suggestion):
(1 mark) Demand and supply both shift left. Which change is certain: price or quantity?
(3 marks) qD = 400 − 4p and qS = 6p − 100 for p ≥ 20 (zero below). Find p* and q*, and the excess demand at Rs 40. (Answer: p* = Rs 50, q* = 200 units; excess demand of 100 units.)
(4 marks) A new bus route brings more buyers to a weekly vegetable market just as a hailstorm damages crops. With a diagram, show why price rises but quantity is uncertain.
(6 marks) With a diagram, explain why a floor above equilibrium causes a surplus, and what the government must then do.
If you get stuck on a shift question, Fermi's AI tutor works out what you already know and builds a plan for the session.