On this page
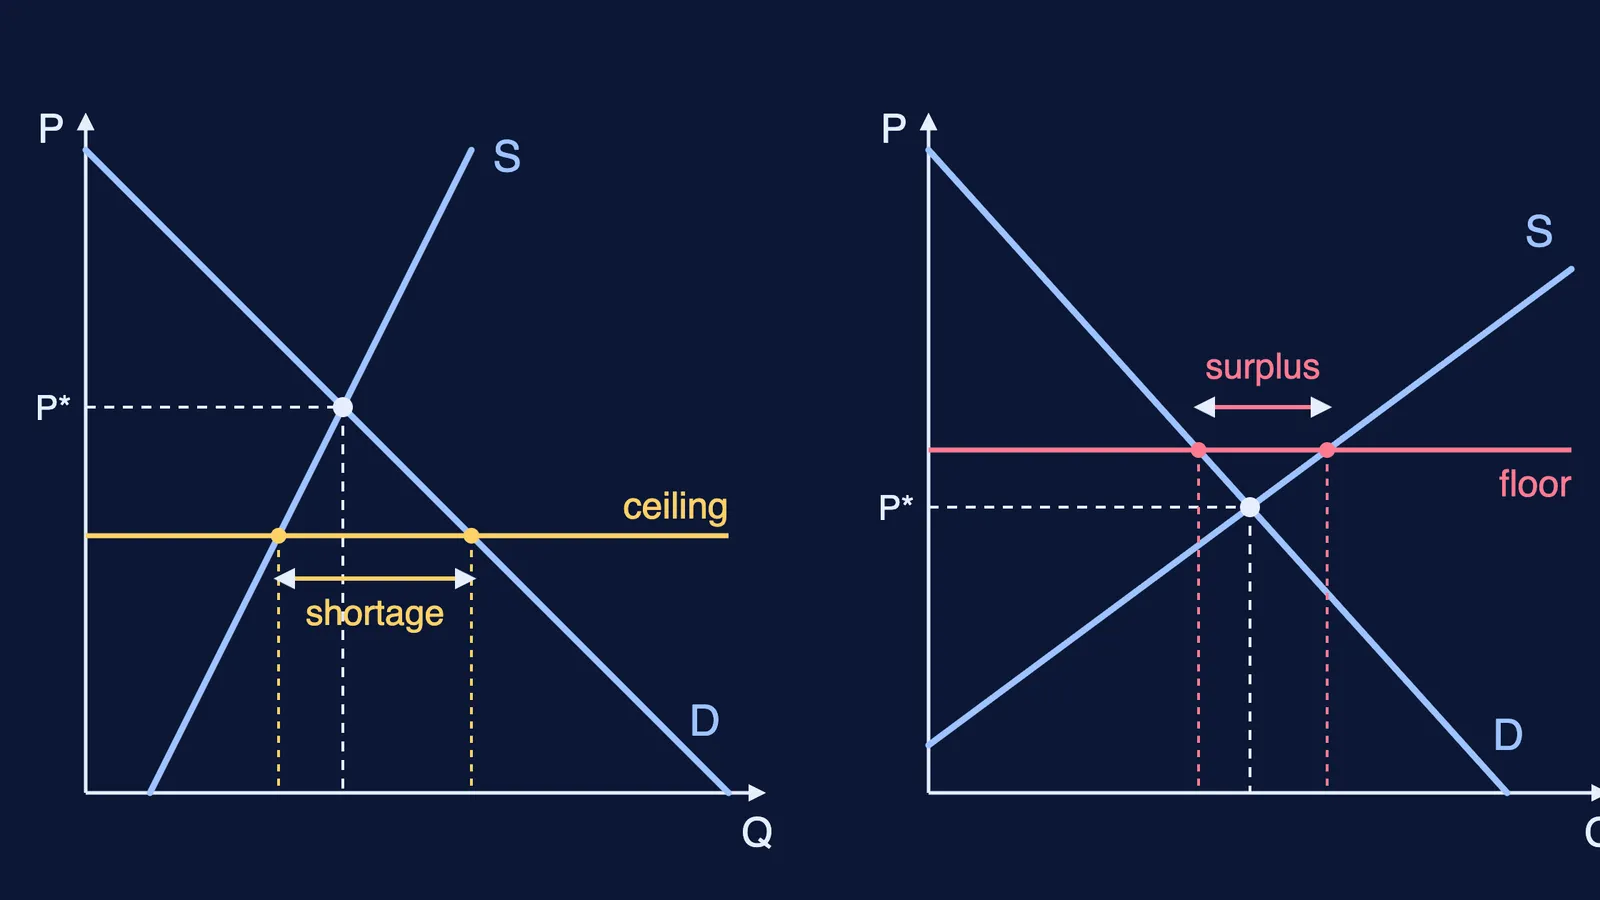
Price ceiling and price floor sit in Unit 7 of the CBSE Class 11 economics syllabus for 2026-27, listed as "Simple Applications of Demand and Supply". That unit carries 8 marks. It is one diagram drawn twice, and what matters is which side of equilibrium you draw the line. Everything below follows Section 5.2 of NCERT Introductory Microeconomics, Chapter 5.
What is a price ceiling and a price floor?
NCERT defines a price ceiling as "the government-imposed upper limit on the price of a good or service" (NCERT Chapter 5). It is fixed below the market price because, at that price, some people could not afford necessities; NCERT's examples are wheat, rice, kerosene and sugar.
NCERT defines a price floor as "the government-imposed lower limit on the price that may be charged for a particular good or service" (NCERT Chapter 5). Its best-known examples, the chapter says, are agricultural price support programmes and minimum wage laws.
The one rule to remember, from the chapter summary: a ceiling below the equilibrium price leads to excess demand, and a floor above the equilibrium price leads to excess supply. A ceiling set above equilibrium, or a floor set below it, changes nothing, because the market price already satisfies it.
How does rent control work on a demand-supply diagram?
NCERT's own exercise 25 asks this: if market rents are too high and the government caps them, what happens to the market for apartments (NCERT Chapter 5)? Rent control is a price ceiling.
Draw demand (D) and supply (S) for rented flats. They cross at the equilibrium rent P* and quantity Q*.
Draw the ceiling as a horizontal line below P*.
Read across: at the capped rent, tenants want more flats than owners offer. The gap is the shortage.
For wheat, NCERT says one way to share out the shortage is rationing through fair price shops, which can bring long queues and, because some buyers will pay more, a black market. The same logic applies to flats: some tenants may offer extra money off the record.
How is minimum support price a price floor?
Minimum support price is India's version of what NCERT calls an agricultural price support programme: a lower limit on the purchase price of some crops, which the chapter says is normally set above the market-determined price (NCERT Chapter 5). At that price farmers supply more than buyers want, so there is a surplus. NCERT states that, to stop the price falling, the government needs to buy the surplus at the predetermined price.
The Commission for Agricultural Costs and Prices has the mandate to advise on the price policy of paddy, wheat, pulses, oilseeds, cotton, jute, copra, sugarcane and other crops the government adds.
Can you solve a price ceiling numerical?
These equations are made up for practice, in the style of NCERT's exercises 22 to 24 (NCERT Chapter 5); the diagram above plots them.
Rent control. Demand for flats is Qd = 100 - 4P and supply is Qs = 10 + 2P, with P in thousand rupees a month and Q in hundreds of flats.
Equilibrium: 100 - 4P = 10 + 2P, so P* = 15 and Q* = 40.
Ceiling at P = 10: Qd = 60 and Qs = 30.
Shortage = 60 - 30 = 30, that is 3,000 flats.
Minimum support price. Demand for a grain is Qd = 90 - 2P and supply is Qs = 3P - 10, with P in rupees per kg and Q in lakh tonnes.
Equilibrium: 90 - 2P = 3P - 10, so P* = 20 and Q* = 50.
Floor at P = 24: Qd = 42 and Qs = 62.
Surplus = 62 - 42 = 20 lakh tonnes, which the government must buy at the floor price.
Cost: 20 lakh tonnes is 200 crore kg; at 24 rupees a kg that is 4,800 crore rupees.
The last line is the policy point: a floor helps farmers, and someone pays for the surplus. The algebra is two simultaneous linear equations; if that step trips you, the Fermi Problem Library has a step-by-step solver that explains the reasoning rather than printing an answer.
How do you write a price ceiling answer in the exam?
Use this six-step checklist for a diagram answer:
Axes labelled Price and Quantity; D sloping down, S sloping up.
Mark equilibrium E with P* and Q* on the axes.
Draw the control line: ceiling below P*, floor above P*.
Mark where it meets D and S and drop dotted lines to the quantity axis.
Name the gap: excess demand (shortage) or excess supply (surplus).
Write one consequence: rationing, queues and a black market for a ceiling; government purchase of the surplus for a floor.
If a curve shift question still confuses you, our guide to checking a demand-supply shift diagram by sketching first uses the same habit. For index numbers, also in the Class 11 syllabus, try building a samosa price index.