On this page
CBSE's 2025-26 Class XI curriculum lists the demand schedule, the demand curve and its slope, and movement along and shifts in the demand curve under Unit 5, Consumer's Equilibrium and Demand, which carried 14 of the 40 microeconomics marks that year (CBSE Economics curriculum 2025-26).
What is the law of demand in Class 11?
NCERT defines it this way: other things being equal, there is a negative relation between the demand for a commodity and its price (NCERT Introductory Microeconomics, Chapter 2).
The "other things" are the consumer's income, the prices of other goods, and the consumer's tastes and preferences. The demand curve is drawn with all three held fixed.
The same chapter gives two reasons the curve slopes down. The substitution effect: when bananas get cheaper, the consumer swaps some mangoes for bananas. The income effect: a lower price raises her purchasing power, so she can afford more bananas. Our guide to indifference curves and the budget line covers the tools NCERT uses to derive the curve.
How do you make a demand schedule and draw the demand curve?
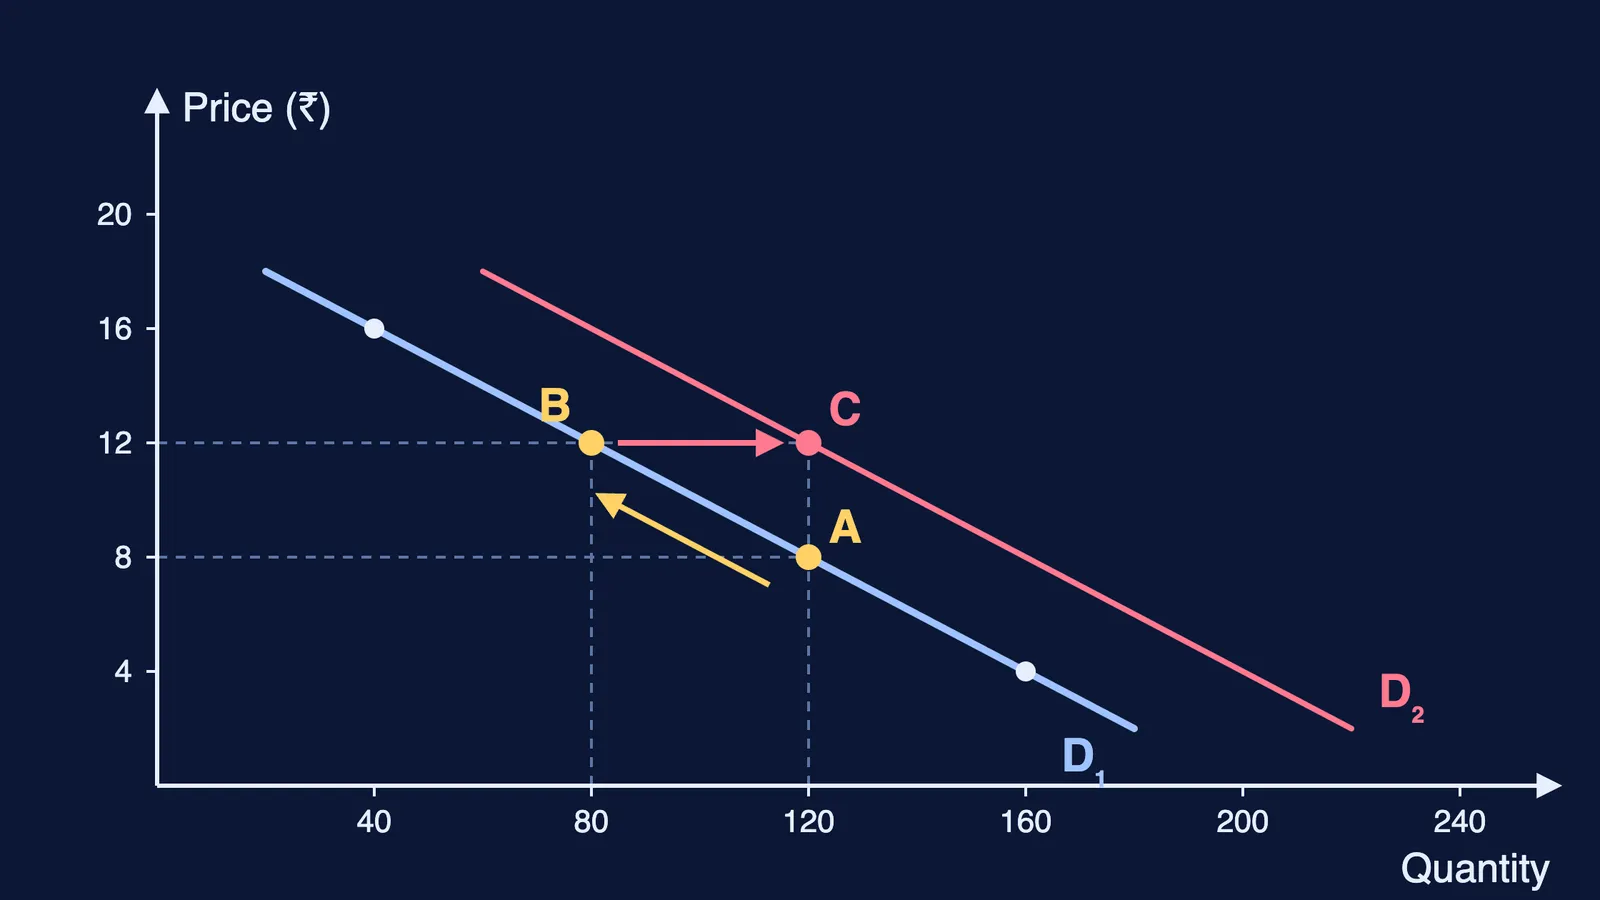
A demand schedule is a table of prices and the quantity bought at each one. A worked example, with made-up canteen numbers and NCERT's linear form d(p) = a − bp, a = 200, b = 10:
At ₹4 a samosa, 160 are bought a day
At ₹8, 120 a day
At ₹12, 80 a day
At ₹16, 40 a day
To draw the curve, put price on the vertical axis and quantity on the horizontal axis (NCERT notes this reverses the usual maths habit). Join the four points: you get a straight line sloping down. Its slope tells you that every ₹1 rise in price cuts sales by b = 10 samosas.
What is the difference between a movement along and a shift in the demand curve?
NCERT's rule: a change in the good's own price leads to a movement along the demand curve, and a change in any of the other things leads to a shift of the curve (NCERT, Chapter 2, section 2.4.6).
In the canteen example, if the price goes up from ₹8 to ₹12, sales fall from 120 to 80. You slide along the same curve, from A to B in the diagram above.
Now suppose pocket money rises. Samosas are a normal good, and NCERT says higher income shifts a normal good's demand curve right. Say the new schedule is 240 − 10p: at the same ₹12, the canteen now sells 120 (point C). The price did not change; the whole curve moved.
Test any exam scenario with four questions:
Did the good's own price change? It is a movement along the curve.
Did income change? The curve shifts right for a normal good and left for an inferior good.
Did a related good's price change? A dearer substitute shifts it right (tea when coffee costs more); a dearer complement shifts it left (tea when sugar costs more).
Did tastes change? Ice-cream demand shifts right in summer; news that cold drinks may harm health shifts their demand left.
Keep the words apart in your answer too: write "quantity demanded fell" for a movement and "demand increased" for a shift.
What are the exceptions to the law of demand?
The case NCERT describes is a Giffen good. When income and substitution effects pull in opposite directions and the income effect is stronger, demand rises with price (NCERT, Chapter 2, section 2.4.3).
In 2008, Robert Jensen and Nolan Miller reported what they called the first real-world evidence of Giffen behaviour: subsidising staple foods for extremely poor households in two provinces of China, they found strong evidence for rice in Hunan and weaker evidence for wheat in Gansu (Jensen and Miller, 2008).
Guidebooks often add goods bought to show off, or panic buying before an expected price rise. In each, something besides today's price has changed: tastes, or what buyers expect tomorrow's price to be. That is closer to a shift than a broken law.
How should you revise this chapter in 20 minutes?
Write the law from memory, including "other things being equal".
Pick your own a and b, build a four-row schedule and plot it.
Run the four-question test on six made-up headlines, such as "coffee prices jump" (for tea: a right shift).
Explain a Giffen good in 60 words without notes.
If you get stuck at step 3, Fermi's AI tutor works out what you already know, builds a plan for the session and checks your understanding as it goes, so you find the gap before the exam does.
The law of demand is half the picture. Next, read the law of supply and market equilibrium, then see both curves at work in price ceilings and price floors.