
On this page
Introduction to Statistics, the first chapter of NCERT's Statistics for Economics, answers two questions: what economics studies, and why economists need numbers to study it. This guide follows the 2026-27 CBSE curriculum and the current NCERT text, with two worked examples and practice questions of our own.
What does this chapter cover in the 2026-27 CBSE syllabus?
The CBSE Economics curriculum for 2026-27 lists it as Unit 1 of Part A: what economics is, and the meaning, scope, functions and importance of statistics in economics. Nothing in the chapter is dropped.
The marks table prints one figure, 15 marks, against Introduction and Collection, Organisation and Presentation of Data together, out of 40 for Statistics for Economics (CBSE curriculum, Class XI). The NCERT chapter, Introduction, is marked "Reprint 2026-27" on every page.
What is economics, according to NCERT?
NCERT starts from Alfred Marshall's idea of economics as the study of people in the ordinary business of life (NCERT, Chapter 1). Economic activities are those done for monetary gain, whether you are a consumer, seller, producer, employee or employer.
NCERT treats scarcity as the source of every economic problem. Wants are unlimited, but the resources that satisfy them are limited and have alternative uses. Land that grows rice could grow cotton instead, so someone must choose.
NCERT discusses economics in three parts:
Consumption: how a consumer, given an income and prices, decides what to buy.
Production: how a producer decides what to make, and how, for sale.
Distribution: how national income (GDP) is shared out as wages, profits, rent and interest.
Modern economics also studies poverty, inequality and disasters, and these need facts in numbers.
What is statistics, and what kinds of data does economics use?
NCERT describes statistics as the study of collecting, presenting, analysing and interpreting numerical data (NCERT, Chapter 1). Economic facts in numerical form are called economic data.
Quantitative data can be measured: prices, incomes, taxes, output. Qualitative data describe attributes that cannot be measured directly, such as gender or skill, though they can be ranked (unskilled, skilled, highly skilled).
Worked example 1: making a vague fact exact. A hypothetical bakery sold 1,250 loaves in March and 1,600 in April.
Increase: 1,600 − 1,250 = 350 loaves.
Percentage increase: 350 ÷ 1,250 × 100 = 28%.
Ratio: 1,600 ÷ 1,250 = 1.28, so April's sales were 1.28 times March's.
Average daily sales in April (30 days): 1,600 ÷ 30 = 53.3 loaves.
"Sales went up a lot" is vague; "sales rose 28% in a month" is exact. The loaf count is quantitative data; a customer's rating of the bread (poor, good, excellent) is qualitative.
How does statistics help in economics?
NCERT describes these functions:
Makes facts exact. Precise figures convince more than vague ones.
Condenses mass data. One average summarises thousands of incomes.
Finds and tests relationships. Does demand fall when price rises? An economist can assume a relationship and test it on data.
Predicts. Past consumption data help forecast future demand.
Guides policy. Deciding how much oil to import needs estimates of domestic production and demand.
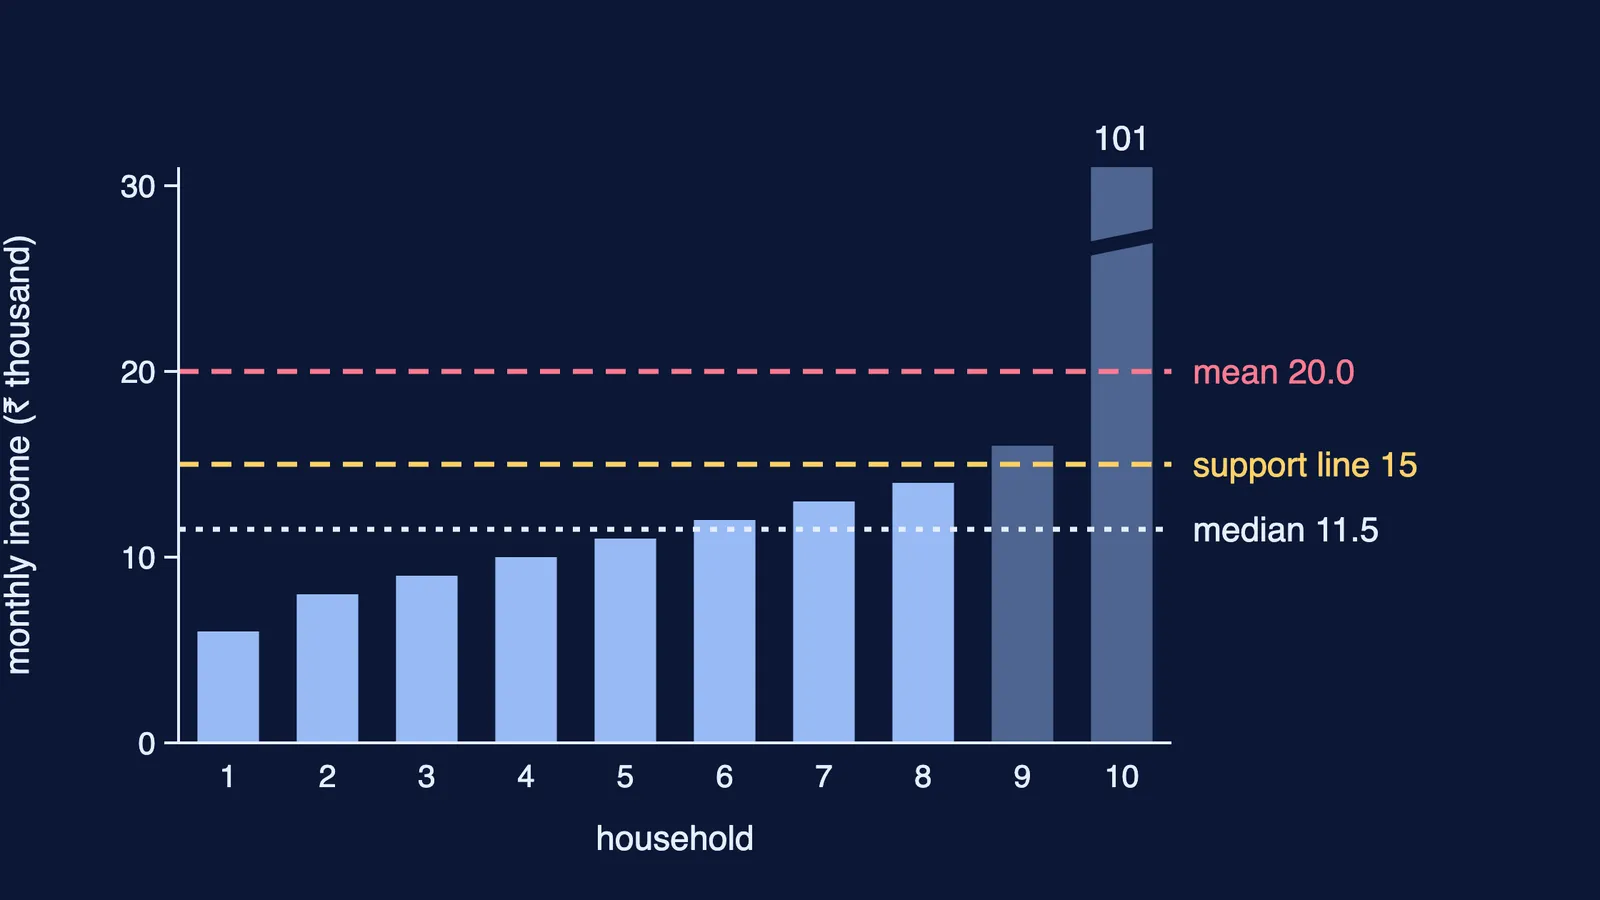
Worked example 2: averages need common sense. NCERT warns that statistical methods cannot replace good judgement. Here is our own example, drawn above. A hypothetical village has 10 households with monthly incomes (₹ thousand) of 6, 8, 9, 10, 11, 12, 13, 14, 16 and 101. A scheme supports households earning below ₹15,000 a month.
Mean income: 200 ÷ 10 = ₹20,000, above the line.
Median income: (11 + 12) ÷ 2 = ₹11,500, below it.
Households below the line: 8 of 10.
Judged by the mean alone, the village needs no support, yet 8 of 10 households qualify. One large income pulls the mean up. The arithmetic is right; the mistake is using the mean for a question about how many households fall below a line.
Practice questions for Introduction to Statistics
At a vegetable market you note the price of onions, the kilograms sold, a freshness grade (fresh, average, stale) and the seller's gender. Which are quantitative and which qualitative?
A shop's daily sales were ₹4,200, ₹3,800 and ₹5,000. Find the mean and say how it condenses data.
A farmer's 2 hectares can grow either wheat or mustard this season. Use this to explain scarcity and alternative uses.
A state wants to know whether a free bus pass raised school attendance. Which function of statistics is this, and what data would you need?
A district's average rainfall this year was normal, so officials say no farmer faced drought. What is wrong with this reasoning?
Answer to 2: (4,200 + 3,800 + 5,000) ÷ 3 = ₹4,333.33.
What should you study next?
Next, read collecting data for Class 11 economics. The mean and median from the village example come back in measures of central tendency for Class 11, and testing relationships becomes correlation in Class 11 statistics.
Not sure where to start? Fermi's AI tutor can work out what you already know and build a plan for the session, so you start with a clear next step.