
On this page
Introduction to Maps is Chapter 1 of NCERT's Practical Work in Geography Part I, the book behind your Class 11 practical exam. Every later practical chapter builds on it. Below: what the written paper, file and viva need, a worked area sum and practice questions we wrote.
What does the 2026-27 syllabus include?
The CBSE 2026-27 Geography curriculum lists four topics for this chapter: essentials of map making, history of map making, types of maps and uses of maps. The chapter carries 3 marks in the practical book's 30-mark weightage table.
The same document splits the practical assessment into a 25-mark written exam, 3 marks for the practical file and 2 marks for the viva. The file must be handwritten, with a cover page, index and acknowledgment.
What is a map, and how is it different from a sketch?
The NCERT chapter (2026-27 reprint) describes a map as a reduced-scale drawing of the earth, or any part of it, on a flat sheet, in which features are chosen for a purpose, shown with symbols and simplified. Examiners look for three keywords: selective, symbolised and generalised.
Selective means it shows only what its purpose needs; symbolised means features become symbols, colours and shades; generalised means detail is simplified to suit the scale.
Lines and polygons drawn without a scale are not a map; NCERT calls them a sketch, drawn freehand without true scale or orientation. Expect this in the viva.
What are the five essentials of map making?
NCERT lists five processes common to every map:
Scale: the first decision; it limits how much information the map can hold.
Projection: flattening the curved geoid, which always distorts some directions, distances, areas or shapes (Chapter 4; see why Greenland looks so big on maps).
Generalisation: selecting data for the map's purpose and simplifying it.
Map design: symbols, lettering, line widths, colours and the legend.
Construction and production: once pen and ink, now computer-assisted.
How are maps classified by scale and function?
By scale (NCERT):
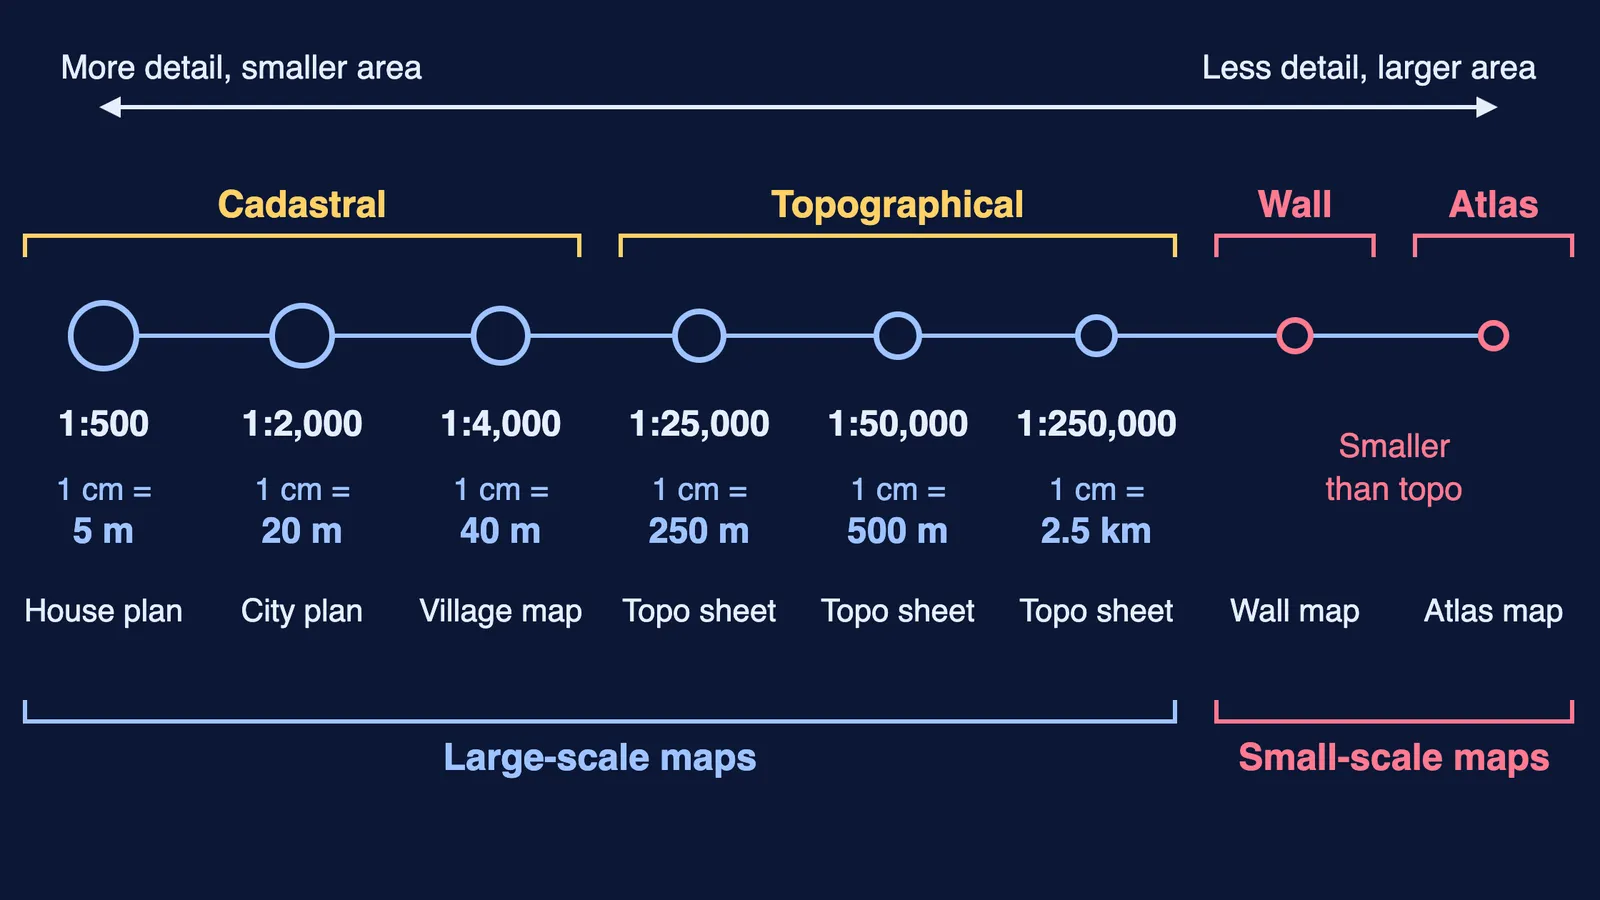
Large-scale maps show small areas in detail. Cadastral maps record land ownership for revenue (villages at 1:4,000, city plans at 1:2,000 and larger). Survey of India topographical maps cover the whole country at three scales: 1:25,000, 1:50,000 and 1:250,000.
Small-scale maps show large areas. Wall maps sit between topographical and atlas maps in scale; atlas maps have the smallest scale and the most generalised picture.
The hero diagram puts these on one line. Its "1 cm =" values are our arithmetic: at 1:50,000, 1 cm stands for 50,000 cm, or 500 m.
By function: physical maps (relief, geological, climatic, soil) show natural features, and cultural maps (political, population, economic, transportation) show human-made features.
How did map making develop, and what are maps used for?
From the NCERT chapter:
The oldest known map, on a clay tablet from Mesopotamia, dates to 2,500 B.C.
Modern cartography rests on work by Greek and Arab geographers, who measured the earth's circumference and used geographical coordinates.
In India its roots go back to the Vedic period; the ideas were later set down as sidhantas in classical treatises by Arya Bhatta, Varahamihira, Bhaskara and others. Ancient Indian scholars pictured the known world as seven dwipas.
Todarmal made land surveying and map making part of revenue collection, and Sher Shah Suri's revenue maps also enriched mapping in the medieval period.
The Survey of India was set up in 1767, and its surveys led to the map of Hindustan in 1785.
Maps are used to measure distance (dividers, thread or a rotameter), direction (north is the base direction) and area (squares or a polar planimeter).
Worked example. NCERT's method: area = (whole squares + partial squares ÷ 2) × the ground area of one square. Suppose a lake on a 1:50,000 map covers 42 whole 1 cm squares and 18 partial ones. One square is 500 m × 500 m = 0.25 sq km. Area = (42 + 9) × 0.25 = 12.75 sq km.
Practice questions for Introduction to Maps
Why is a freehand drawing of your street without a scale not a map? (1 mark)
A map is drawn at 1:2,000. Name its type and give one use. (1 mark)
Explain why the choice of scale comes first in map making. (2 marks)
A district covers 30 whole and 14 partial squares of 1 cm on a 1:250,000 map. Find its area. (3 marks)
Classify maps by function, with two examples each, and say which a town planner would need. (5 marks)
For question 4, one square is 2.5 km × 2.5 km, so the answer is 37 × 6.25 = 231.25 sq km.
For your file, add a labelled scale line like the hero. Contours come later (how to read contour lines); theory-paper map work is in our Drainage System guide.
If you get stuck on a scale conversion, Fermi's AI tutor can work out what you already know and build a plan for the session.