On this page
On most wall maps and phone maps Greenland looks about the size of Africa. It isn't close. The cause is a choice of maths made in 1569, and one formula tells you how wrong any part of the map is.
Why does Greenland look so big on a Mercator map?
The Mercator projection was first presented by the Flemish mapmaker Gerardus Mercator in 1569, according to Wikipedia's article on the Mercator projection. It is a cylindrical, conformal map: it keeps angles correct at every point, so a constant compass bearing is a straight line.
The map pays for those angles with size. On a globe, circles of latitude shrink towards the poles; on Mercator's rectangle each is drawn as long as the equator. A parallel at latitude φ is stretched sideways by sec φ (1/cos φ), and north-south by the same factor so small shapes stay right (Mercator projection, Wikipedia). Stretch both ways by sec φ and areas grow by sec² φ: for Greenland, taking 73° as its middle latitude, about 11.7.
Greenland covers 2,166,086 km² (Greenland, Wikipedia). Africa covers about 30.3 million km², around 20% of Earth's land (Africa, Wikipedia). Divide one by the other and Africa is about 14 times larger than Greenland, the same ratio given in the Mercator projection article and by NPR in August 2025. Africa straddles the equator, so it is stretched far less, while Greenland is blown up about 12 times. That is why the two look roughly the same size.
How much does Mercator stretch places near the poles?
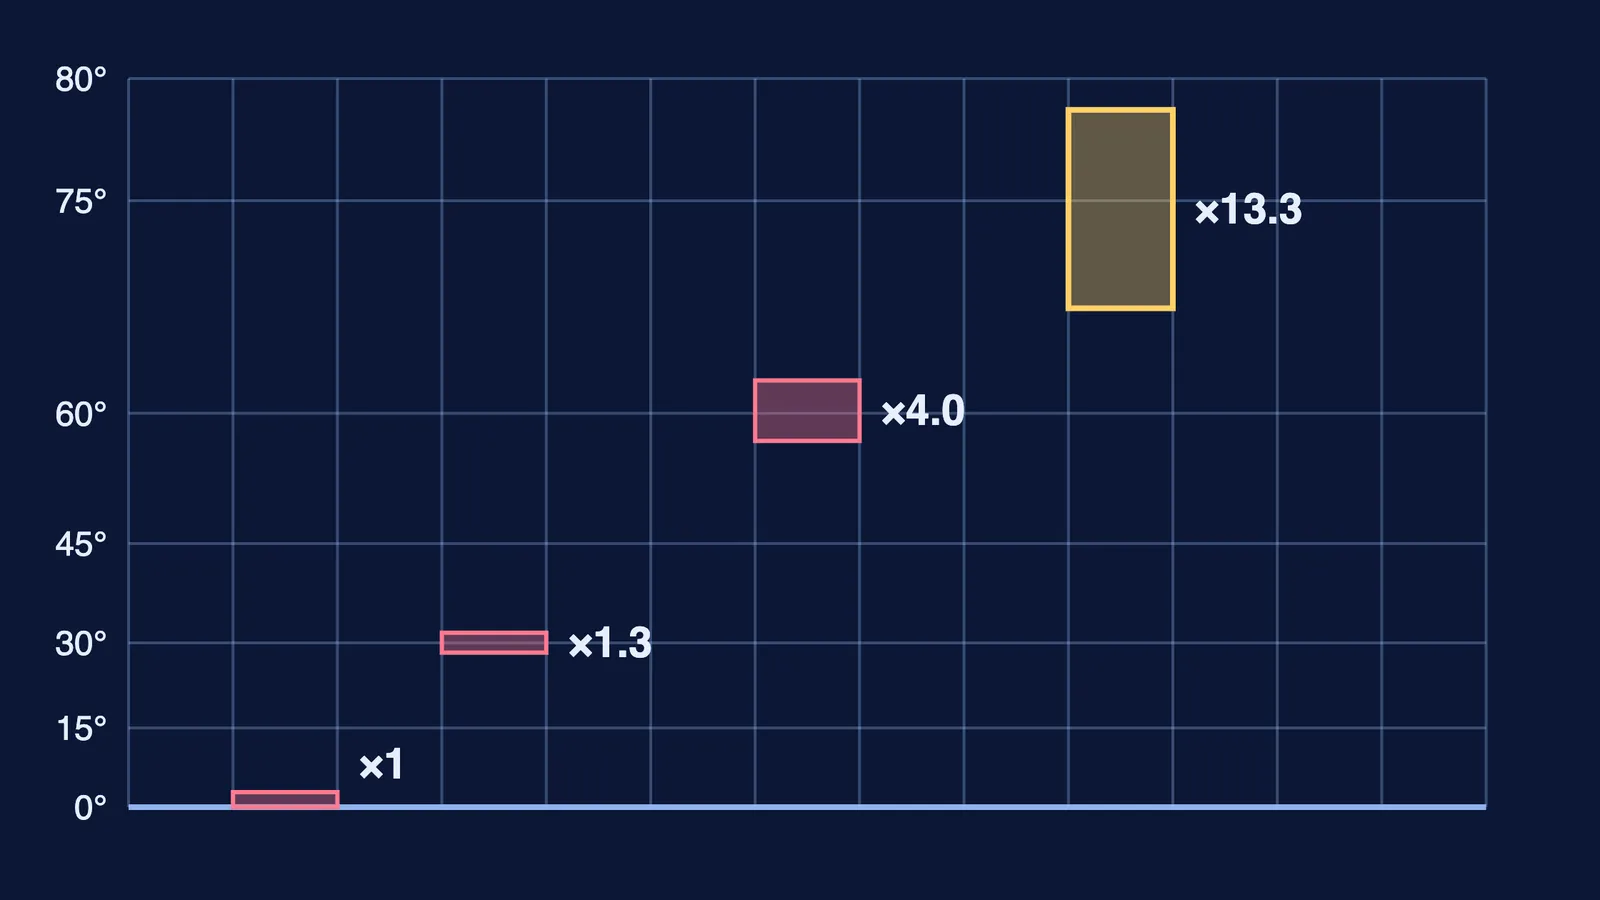
You can get these numbers yourself from sec² φ = 1/cos² φ, the formula in the Mercator projection article. Area stretch compared with the equator:
0° (equator): 1 time
23° (roughly the middle of India): about 1.18 times
30°: about 1.33 times
45°: 2 times
60°: 4 times
73° (middle of Greenland): about 11.7 times
80°: about 33 times
A worked example: India covers 3,287,263 km² and lies between about 8° and 37° north (Geography of India, Wikipedia). That makes India about 1.5 times the size of Greenland (3,287,263 ÷ 2,166,086 ≈ 1.52).
Pick a middle latitude for each: about 23° for India, 73° for Greenland.
Find the area stretch: sec² 23° ≈ 1.18 and sec² 73° ≈ 11.7.
Multiply by real area: India ≈ 3.29 × 1.18 ≈ 3.9; Greenland ≈ 2.17 × 11.7 ≈ 25 (both in millions of km² "as drawn").
Compare: on the map Greenland comes out about six and a half times bigger than India (25 ÷ 3.9), though India is the larger one.
The stretch varies across each country, so this is rough, but the direction is certain: the further from the equator, the more Mercator flatters a country.
Why do we still use the Mercator projection?
Because it does its original job well. It let explorers plot a course as a straight line without adjusting their compasses. Cartographer Tom Patterson told NPR that institutions may also choose it so that a circular object does not become an oval when users zoom in (NPR).
The trouble starts when a navigation chart becomes the classroom world map. No flat map keeps every shape and every area true at once, so each world map is a trade-off.
What do equal-area maps like Equal Earth change?
An equal-area map shows the true relative sizes of countries and continents, at the cost of distorting their shapes (NPR). One such map is the Equal Earth projection, published in 2018 by Bojan Šavrič, Tom Patterson and Bernhard Jenny in the International Journal of Geographical Information Science.
In August 2025 NPR reported that the African Union had joined the "Correct The Map" campaign, which wants Mercator replaced with a map that more accurately reflects Africa's relative size. The World Bank told NPR it is phasing out Mercator in favour of Equal Earth (NPR).
How do you check whether a map is lying about size?
A two-minute check for any world map, in an atlas, textbook or app:
Lines of latitude getting further apart towards the poles means sizes are stretched.
Missing poles, or Antarctica as a huge band along the bottom, usually means Mercator.
If Greenland and Africa look similar, the map is not equal-area.
Ask what the map is for: navigation suits Mercator; comparing countries or forest cover needs equal-area.
Before trusting a place's size, estimate its stretch as 1/cos² of its latitude.
The same habit helps with reading contour lines on a topographic map and Class 10 CBSE map work. For the human side, see how Kishen Singh mapped Tibet by counting his steps.
If sec φ and cos φ still feel shaky, the Fermi Concept Library gives every concept in mathematics its own lesson. For ideas that are easier to see than to read, the Fermi Simulation Lab has interactive simulations.
Tonight, try the check on your geography textbook's world map and work out the stretch at your own city's latitude.