On this page
A contour map squeezes three dimensions onto flat paper. A CBSE map-work question and a trek in the Western Ghats need the same skill: seeing the shape of the ground in the lines.
What do contour lines on a map mean?
NCERT's Class 11 textbook Practical Work in Geography defines contours as imaginary lines joining places that have the same elevation above mean sea level (NCERT, Chapter 5: Topographical Maps). The height gap between two neighbouring lines is the contour interval, also called the vertical interval (VI), and it is usually constant on a given map. In India, the Survey of India prepares topographical maps at five scales, from 1:10,00,000 to 1:25,000, according to the same chapter.
Three more rules help:
On many topographic maps, every fifth contour is printed darker as an index contour, so you can count up or down from it (Topographic Map Primer, Bryn Mawr College).
Contours of different heights usually do not cross; where two or more merge into one, you are looking at a cliff or a waterfall (NCERT).
Read the interval in the map legend before anything else. A 20 m gap and a 100 m gap look identical on paper.
How do you tell a steep slope from a gentle one?
The horizontal distance between neighbouring contours is what NCERT calls the horizontal equivalent (HE): it is large on a gentle slope and shrinks as the slope steepens (NCERT). Closely spaced contours mean steep ground; widely spaced contours mean a gentle slope.
On a concave slope the lines are wide apart low down and crowded near the top; on a convex slope it is the reverse, according to the same chapter. Convex slopes need care on a trek, because the gentle top can hide the steep drop below it.
You can turn spacing into a number. Gradient is rise over run, the same idea as the slope of a line through two points.
Worked example: gradient from a 1:50,000 sheet
1:50,000 is one of the Survey of India scales listed by NCERT. Suppose the legend gives a contour interval of 100 m.
Measure the gap between two neighbouring contours along your route: say 1 cm on the map.
At 1:50,000, 1 cm on the map is 50,000 cm, which is 500 m on the ground.
Gradient = 100 ÷ 500 = 1 in 5, or 20 per cent. The angle is tan⁻¹(0.2), about 11 degrees.
If the same two lines were 4 cm apart, the run is 2,000 m: 1 in 20, about 3 degrees.
The 11-degree stretch is a stiff climb with a backpack; the 3-degree stretch is close to level walking. It is also why ghat roads zigzag across contours rather than climbing straight up, as we explain in why mountain roads have hairpin bends.
How do you tell a hill from a valley on a contour map?
The patterns, from NCERT and the Bryn Mawr primer (NCERT; primer):
Hill: closed, roughly concentric rings with values rising inward. A conical hill has evenly spaced rings.
Depression: closed rings with short tick marks (hachures) on the downhill side, such as a crater or sinkhole.
Valley: contours bend into a V or a U. Where a contour crosses a stream, the point of the V points upstream, towards higher ground. In a V-shaped valley, the innermost contour has the lowest value.
Spur: also V-shaped, but reversed: the arms point to higher ground and the tip points to lower ground.
Plateau: contours packed tightly at the edges around a wide, flat top.
The quickest test for any V is to read two labels. If the values rise towards the tip of the V, it is a valley; if they fall, it is a spur.
How do you draw a cross-section from contour lines?
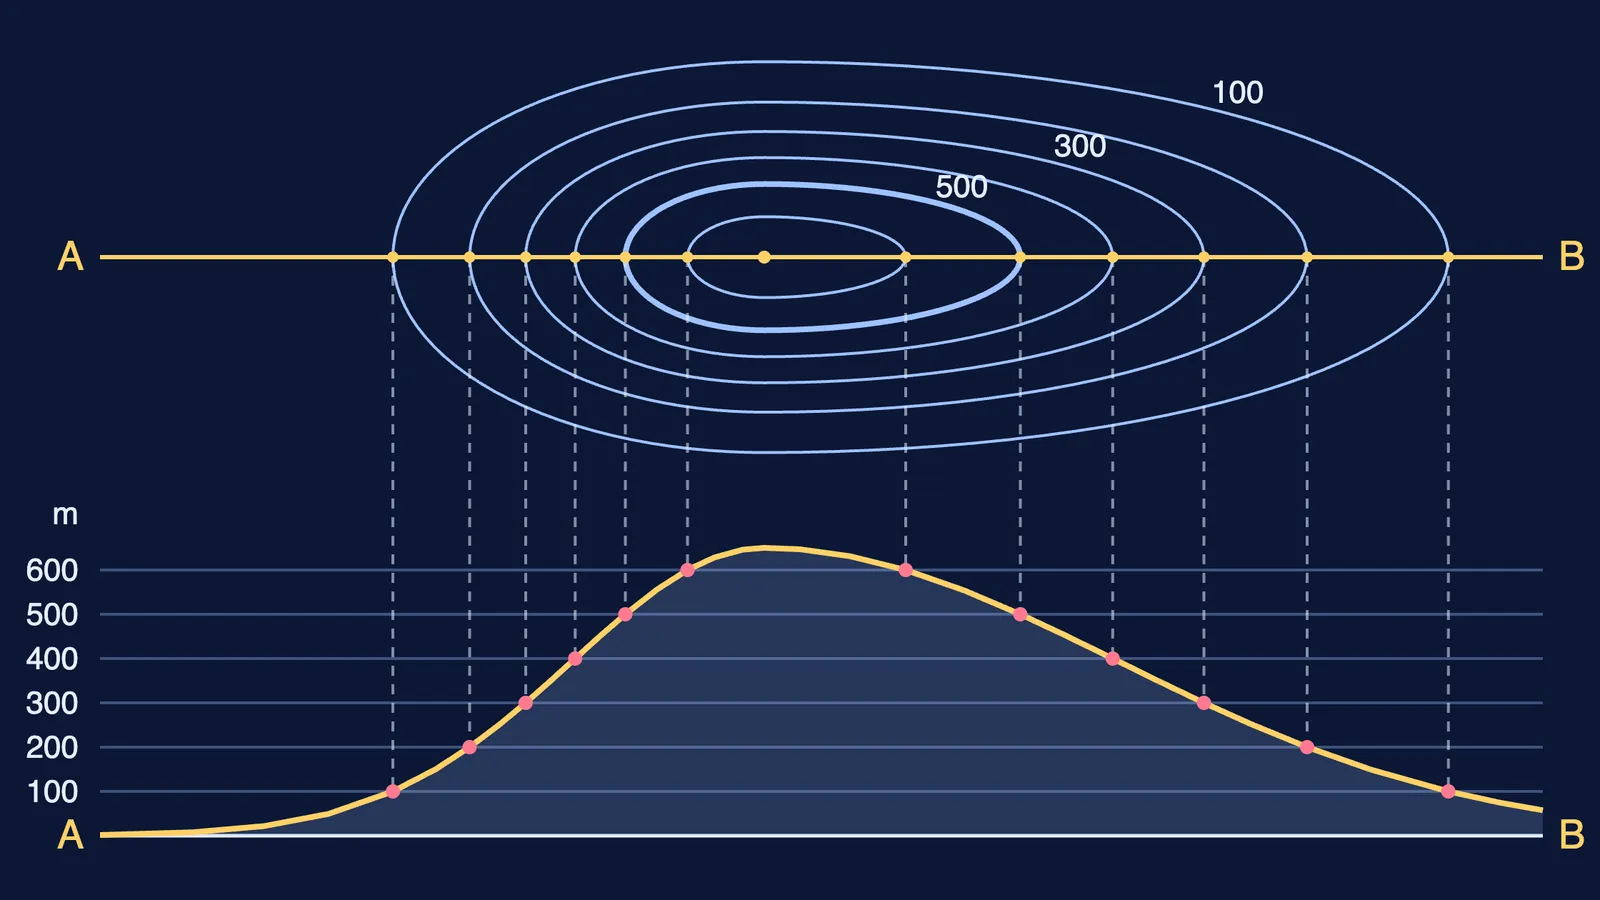
A cross-section is a side view of the ground, as if it were cut vertically along a straight line (NCERT). The textbook's method, condensed:
Draw a straight line AB across the contours.
Lay the edge of a paper strip along AB and mark where each contour crosses it, with its value.
On graph paper, draw horizontal lines as long as AB, one per contour value, with a vertical scale such as ½ cm = 100 m.
Put the strip along the bottom line and draw a perpendicular from each mark up to the line for its height.
Join the points with a smooth curve.
The diagram at the top of this post does exactly this for a model hill. For other ideas that are easier to see than to read, the Fermi Simulation Lab has interactive simulations.
What should you check before a trek or an exam?
Find the contour interval and the scale in the legend.
Locate the index contours, the highest point and the lowest point.
Trace the streams; their V-shaped contours show which way is uphill.
Check the spacing along your route and work out the steepest stretch.
Sketch a quick cross-section of anything that is still unclear.
Preparing for the board map list as well? Our Class 10 geography map work plan sets out a weekly routine.