On this page
India's official unemployment rate comes from one survey, published in more than one way. Know which way a headline uses and the numbers stop contradicting each other.
How is unemployment rate calculated?
Sort people aged 15 and over into three groups: employed, unemployed (no work, but seeking or available for it), or outside the labour force (students, homemakers, retired people and others neither working nor looking).
The labour force is the employed plus the unemployed; India's Periodic Labour Force Survey definitions from MoSPI describe it as persons "working or seeking or available for work".
The unemployment rate is the number of unemployed persons divided by the labour force, multiplied by 100 (MoSPI, PLFS Key Employment Unemployment Indicators 2024).
Two companion numbers come from the same sorting. The Labour Force Participation Rate (LFPR) is the labour force as a percentage of the population, and the Worker Population Ratio (WPR) is the employed as a percentage of the population (MoSPI).
A worked example you can do by hand
Imagine a town with 1,000 people aged 15 and over. In the week before the survey:
520 did some paid or self-employed work (employed)
30 had no work but were looking for it or available (unemployed)
450 were studying, running the home, retired or otherwise not looking (outside the labour force)
Labour force = 520 + 30 = 550
LFPR = 550 ÷ 1,000 × 100 = 55%
WPR = 520 ÷ 1,000 × 100 = 52%
Unemployment rate = 30 ÷ 550 × 100 = 5.45%, about 5.5%
Watch the denominator: dividing 30 by all 1,000 gives 3%, a common mistake. The rate is out of the labour force, not everyone. If percentages and ratios like these feel shaky, the Fermi Concept Library has its own lesson for every mathematics concept, so you can fill the gap before tackling the arithmetic.
The town is invented, but close to India's real figures: the September 2026 PLFS bulletin reported an LFPR of 55.5%, a WPR of 52.7% and an unemployment rate of 5.0% for people aged 15 and over (MoSPI press note, 15 October 2026).
What is the PLFS and how does it collect data?
The PLFS is run by the National Statistics Office under the Ministry of Statistics and Programme Implementation (MoSPI) and was launched in April 2017 (MoSPI). It surveys sampled villages and urban blocks and records what people in selected households did over a reference period.
Its method was changed from January 2025 to give monthly and quarterly estimates (MoSPI, September 2026 bulletin).The September 2026 estimate was based on 3,70,513 persons surveyed: 2,11,333 in rural areas and 1,59,180 in urban areas.
A sample can describe a whole country for the same reason an exit poll can; our explainer on how exit polls use sampling and where their error comes from shows why. A census instead counts everyone; see how the census is conducted in India.
Why do different unemployment figures disagree?
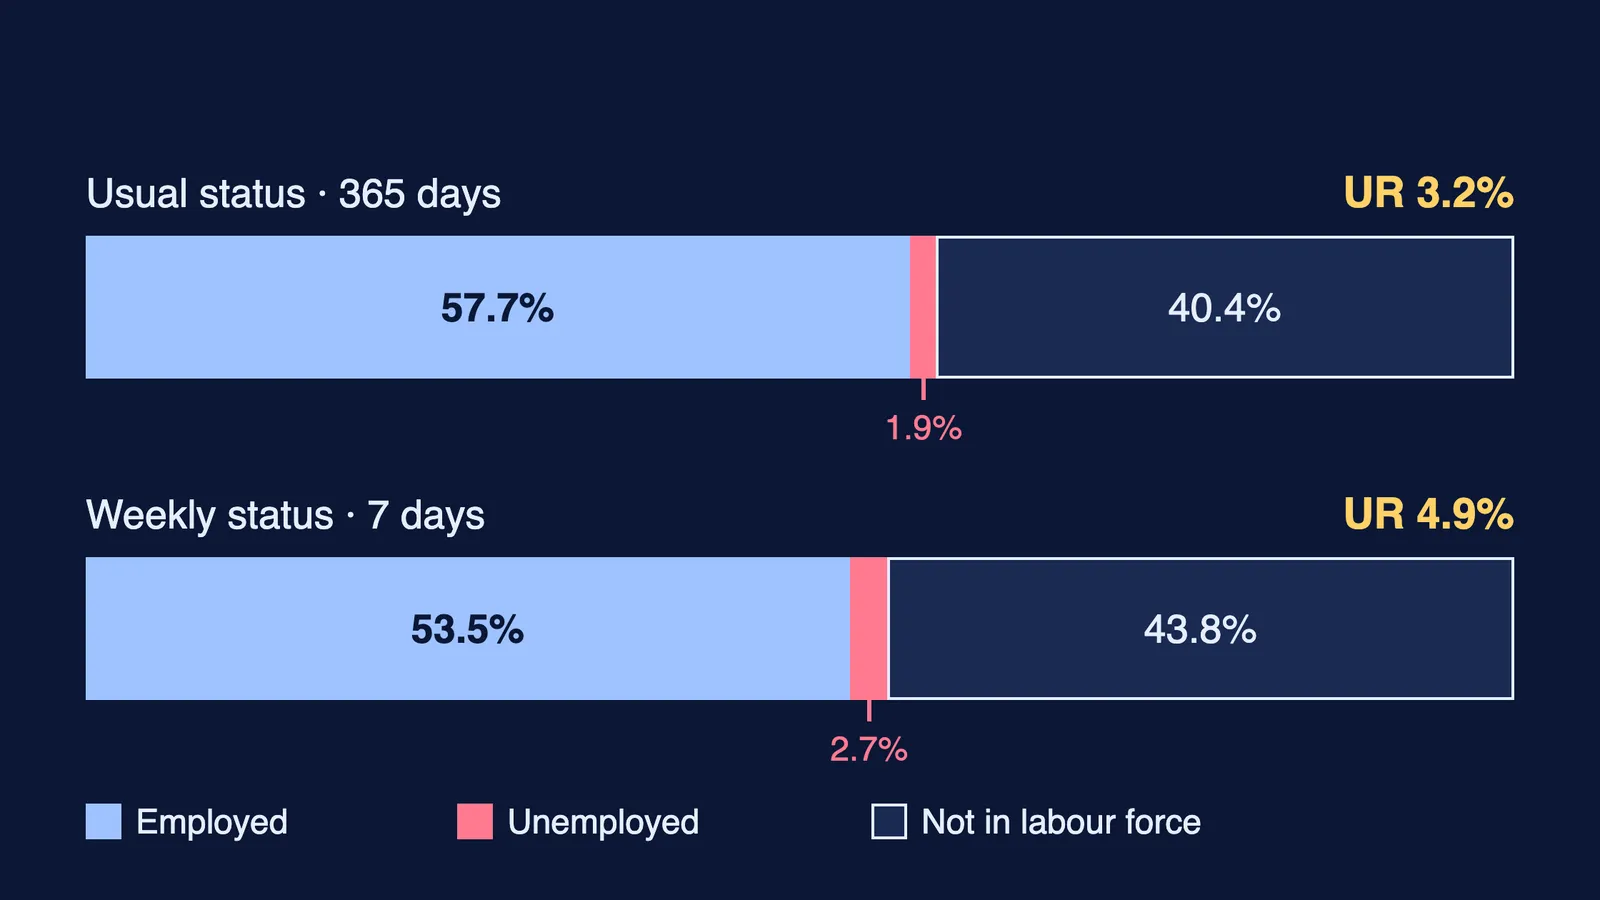
The biggest reason is the reference period, the stretch of time the question asks about. PLFS uses two (MoSPI):
Current Weekly Status (CWS): what a person did in the last 7 days before the survey.
Usual Status (ps+ss): what a person did over the last 365 days. The principal status is the one they spent the major part of the year in; a subsidiary status counts if they also did some economic activity for 30 days or more.
For calendar year 2024, PLFS put the unemployment rate for people aged 15 and over at 3.2% by usual status and 4.9% by current weekly status (MoSPI, Key Employment Unemployment Indicators 2024).
Why the gap? Take Ravi, who worked on a farm for eight months of the past year but had no work last week and was looking. By the 365-day measure he is employed, because work filled most of his year; by the 7-day measure he is unemployed. Both numbers are right: they answer different questions.
Other reasons headlines differ:
Area: in September 2026 the urban rate was 6.9% and the rural rate 4.2% (MoSPI).
Group: the urban female rate was 9.2% in the same month (MoSPI).
Period: a month, a quarter and a year are different averages.
Source: private surveys and international estimates use their own samples and definitions.
How do you read an unemployment headline?
Before sharing a number, ask:
Which survey? MoSPI calls PLFS India's primary source of labour force data.
Which status: weekly (CWS) or usual (ps+ss)?
Which age group: 15 and over, or a youth band such as 15 to 29?
Rural, urban or all-India, and men, women or everyone?
Compared with what: last month, the same month last year, or a different measure?
Asking what exactly is counted works for any national statistic, including the one in our guide to GDP in simple words, with India's numbers.
The September 2026 bulletin was released on 15 October 2026; you can find each new one on the MoSPI website.