
On this page
How Quantities Combine: Understanding Data is Chapter 10 of Ganita Manjari Part II, the NCERT Class 9 maths textbook. The CBSE Class IX Mathematics curriculum for 2026-27 lists, among its Statistics learning outcomes, applying weighted averages and reading stacked and 100% stacked bar graphs. Here are 26 key terms in four groups, with our own examples. For worked examples, see our How Quantities Combine Class 9 chapter guide to weighted mean and stacked bars.
What is a weighted mean in Class 9 maths?
From section 10.1 of the NCERT chapter.
Average (arithmetic mean): the sum of the values divided by how many there are. Example: 4, 6 and 11 average 7.
Combined average: the average of all the data in several collections (groups) together. A collection of n values with average a and one of m values with average b give (an + bm) ÷ (n + m).
Average of averages: adding the averages and dividing by their number. Counter-example: 10 students averaging 60 and 30 averaging 80 have a combined average of 3,000 ÷ 40 = 75, but an average of averages of 70. Don't confuse with: the combined average, which it matches when every collection is the same size.
Weight: how much a value counts: a group size, a quantity or an importance; usually abstract, sometimes a real mass.
Weighted mean (weighted average): multiply each value by its weight, add, and divide by the sum of the weights: (w1x1 + w2x2 + ... + wnxn) ÷ (w1 + w2 + ... + wn). Example: 4 with weight 3 and 9 with weight 1 give 21 ÷ 4 = 5.25. The chapter credits Brahmagupta (c. 628 CE) with writing it down.
Mean after adding or removing values: rebuild the total, change it, and divide by the new count. Example: 9 days averaging 20 km, then 30 km on day 10: (180 + 30) ÷ 10 = 21 km.
How do mixtures and concentration work?
From section 10.1.2 of the NCERT chapter.
Concentration: the quantity of one substance divided by the quantity of the whole mixture. Example: 15 g of sugar in 300 g of drink is 5%.
Concentration of a mixture: the weighted mean of the parts' concentrations, weighted by their volumes or masses. Example: 3 L at 4% and 1 L at 8% give (0.12 + 0.08) ÷ 4 = 5%.
Midway result: equal quantities give a concentration exactly halfway between. Example: 1 L at 4% and 1 L at 8% give 6%. Unequal quantities lean towards the larger part.
Alloy: a metal mixture. Example: brass is copper and zinc; 40 kg of brass that is 60% copper holds 24 kg of copper.
Unknown quantity: call the missing amount y and solve the mixture equation. Example: y L of 10% juice added to 2 L of 30% juice gives 20%: (0.6 + 0.1y) ÷ (2 + y) = 0.2, so y = 2.
Adding plain water: water is a part with concentration 0, so the mixture gets weaker. Example: 5 L at 6% plus 1 L of water is 0.3 ÷ 6 = 5%.
Varṇa: an old Indian measure of gold purity; k varṇa means the alloy is k/16 gold. Example: 12 varṇa is 75% gold. Don't confuse with: karat, where pure gold is 24 (16 varṇa = 24 karat).
What are custom weights?
From section 10.1.3 of the NCERT chapter.
Custom weights: weights chosen for importance, as in final marks or ratings.
Ratio of weights: weights written as a ratio. Example: marks 70, 80 and 60 in the ratio 1 : 1 : 2 give (70 + 80 + 120) ÷ 4 = 67.5%, against a plain average of 70%.
Marks out of different totals: turn each into a percentage before weighting. Example: 18 out of 20 is 90%; 40 out of 50 is 80%.
Doubling all the weights: multiplying every weight by the same number leaves the weighted mean unchanged, since the factor cancels. Don't confuse with: adding the same number to every weight. Counter-example: 0 and 10 with weights 1 and 3 give 7.5; with weights 2 and 4, about 6.67.
Which chart shows totals and which shows shares?
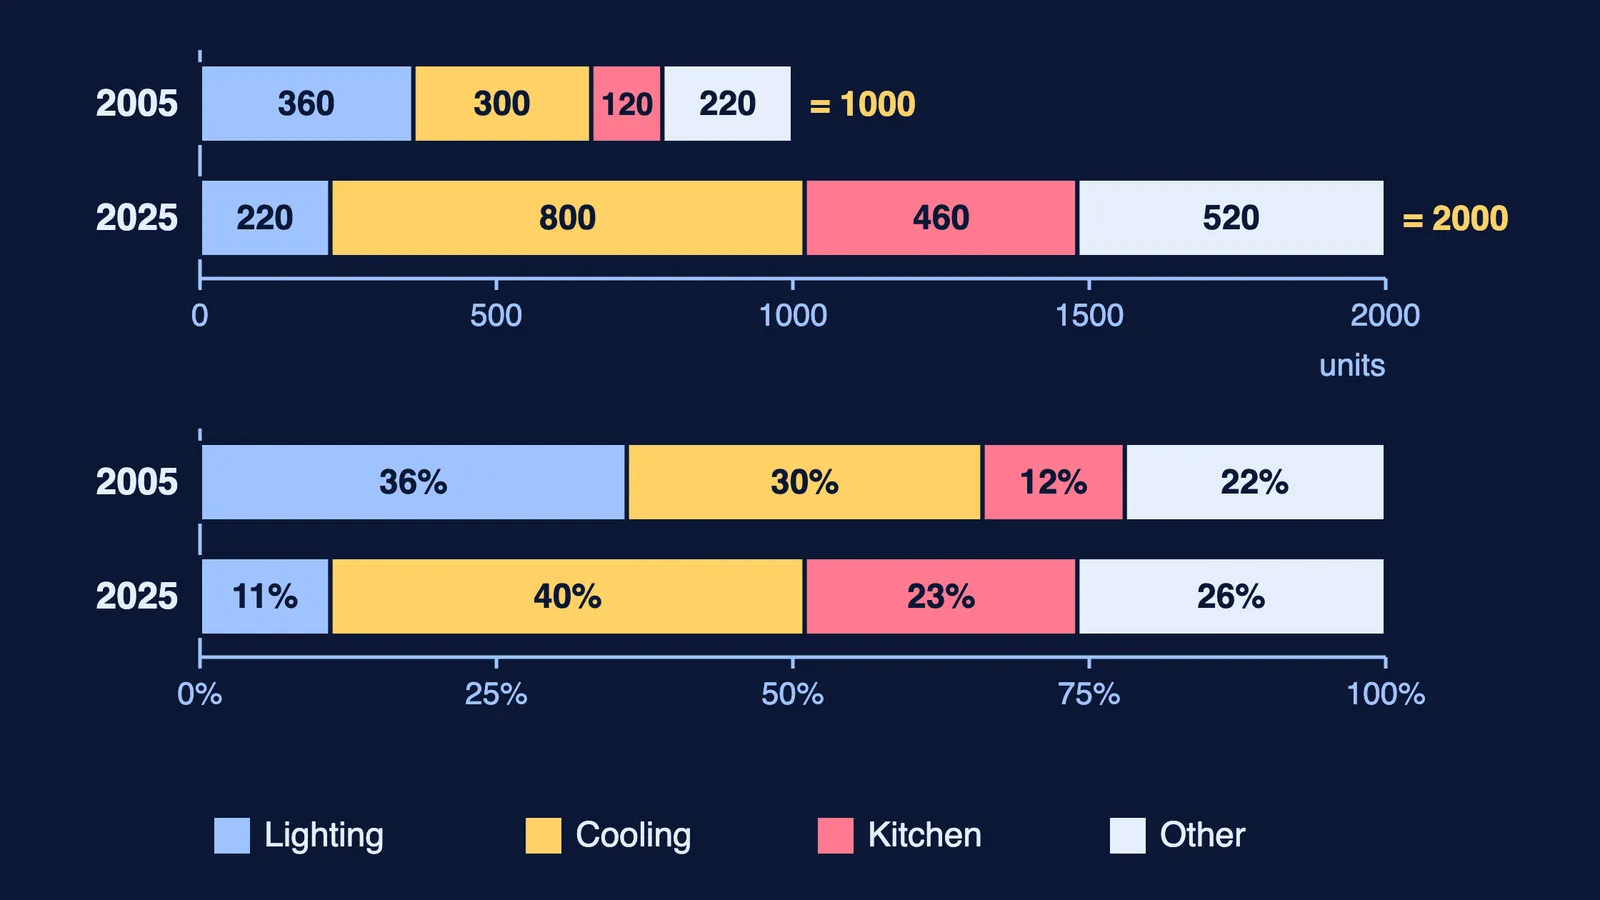
From section 10.2 of the NCERT chapter. Examples use the chapter's electricity table (Example 7), drawn at the top: 360, 300, 120 and 220 units in 2005 (total 1,000); 220, 800, 460 and 520 in 2025 (total 2,000).
Cluster-column chart: each group's bars stand side by side from 0; totals are hard to see.
Stacked bar chart: a group's bars joined end to end, so the full length is the total. Example: the 2005 bar is 1,000 units long.
Smaller bar: one piece inside a stack. Only the first starts at 0, so for the rest read the length, not the end point. Example: cooling in 2005 runs from 360 to 660, which is 300 units.
100% stacked bar chart: every bar has the same length (100%), and each segment shows its share of that bar's total.
Share: part ÷ total × 100. Example: cooling in 2025 is 800 ÷ 2,000 × 100 = 40%.
Proportion vs absolute value: a 100% stacked chart shows only proportions. Example: lighting's share fell from 36% to 11%; only the stacked chart, with its totals, shows it fell from 360 to 220 units.
Pie chart: a circle split by angle; a 100% stacked bar splits a fixed length instead, which is often easier to compare.
One-way conversion: a stacked chart can become a 100% stacked chart, not the reverse; the totals are lost.
Inference: a statement the chart guarantees. Counter-example: 50% of A's flowers and 40% of B's bloomed in summer, yet A need not have more summer flowers.
For median and mode, see our Class 11 guide to measures of central tendency.
How to learn these terms
Learn the pairs together: average of averages and combined average, share and amount.
Before any weighted mean, guess where the answer leans, then check.
Redraw the electricity table as both charts, writing each share on its segment.
Track your own marks the way our guide to a three-mock moving average does.
If a term still feels like a formula to memorise, the Fermi Concept Library gives each concept its own lesson and its place in the map.