
On this page
NCERT's new Class 9 maths book for 2026-27, Ganita Manjari Part II (first edition, August 2026), places "How Quantities Combine: Understanding Data" as Chapter 10, right after Chapter 9 (Part II contents and About the Book, NCERT). Its About the Book note says the chapter develops the weighted average and introduces stacked and 100% stacked bar charts. Every example below uses our own numbers, worked step by step.
What is a weighted mean in Class 9 maths?
A weighted mean multiplies each value by its weight, adds the products, and divides by the sum of the weights (Ganita Manjari Chapter 10, NCERT). In symbols: mean = (w1x1 + w2x2 + ... + wnxn) ÷ (w1 + w2 + ... + wn). A weight can be a count of people, a volume of liquid, or how much a part matters.
The chapter notes that Brahmagupta wrote this formula in his Brāhmasphuṭasiddhānta (c. 628 CE).
How do you find the combined average of two groups?
Class 9A has 40 students averaging 70 in a test; Class 9B has 20 averaging 85.
Tempting but wrong: (70 + 85) ÷ 2 = 77.5, which treats both classes as equal in size.
Rebuild totals: 40 × 70 = 2,800 and 20 × 85 = 1,700.
Divide by everyone: (2,800 + 1,700) ÷ 60 = 4,500 ÷ 60 = 75.
The bigger class pulls the answer towards 70. Adding the averages and dividing by how many there are is safe when every group is the same size; when sizes differ, weight each average by its group size.
Mixtures work the same way. Pour 300 mL of sharbat with 6% sugar into 100 mL with 10% sugar. Sugar: 0.06 × 300 + 0.10 × 100 = 18 + 10 = 28 units in 400 mL. Concentration: 28 ÷ 400 = 7%, not the midpoint 8%, because most of the drink was the 6% one.
Custom weights for marks. Internals, project and final exam count 2 : 1 : 3, and you score 75%, 90% and 68%. Weighted: (75 × 2 + 90 × 1 + 68 × 3) ÷ 6 = (150 + 90 + 204) ÷ 6 = 444 ÷ 6 = 74%. The plain average would be 233 ÷ 3 ≈ 77.7%, which flatters you because your weakest part carried the most weight.
How do you read a stacked bar chart and a 100% stacked bar chart?
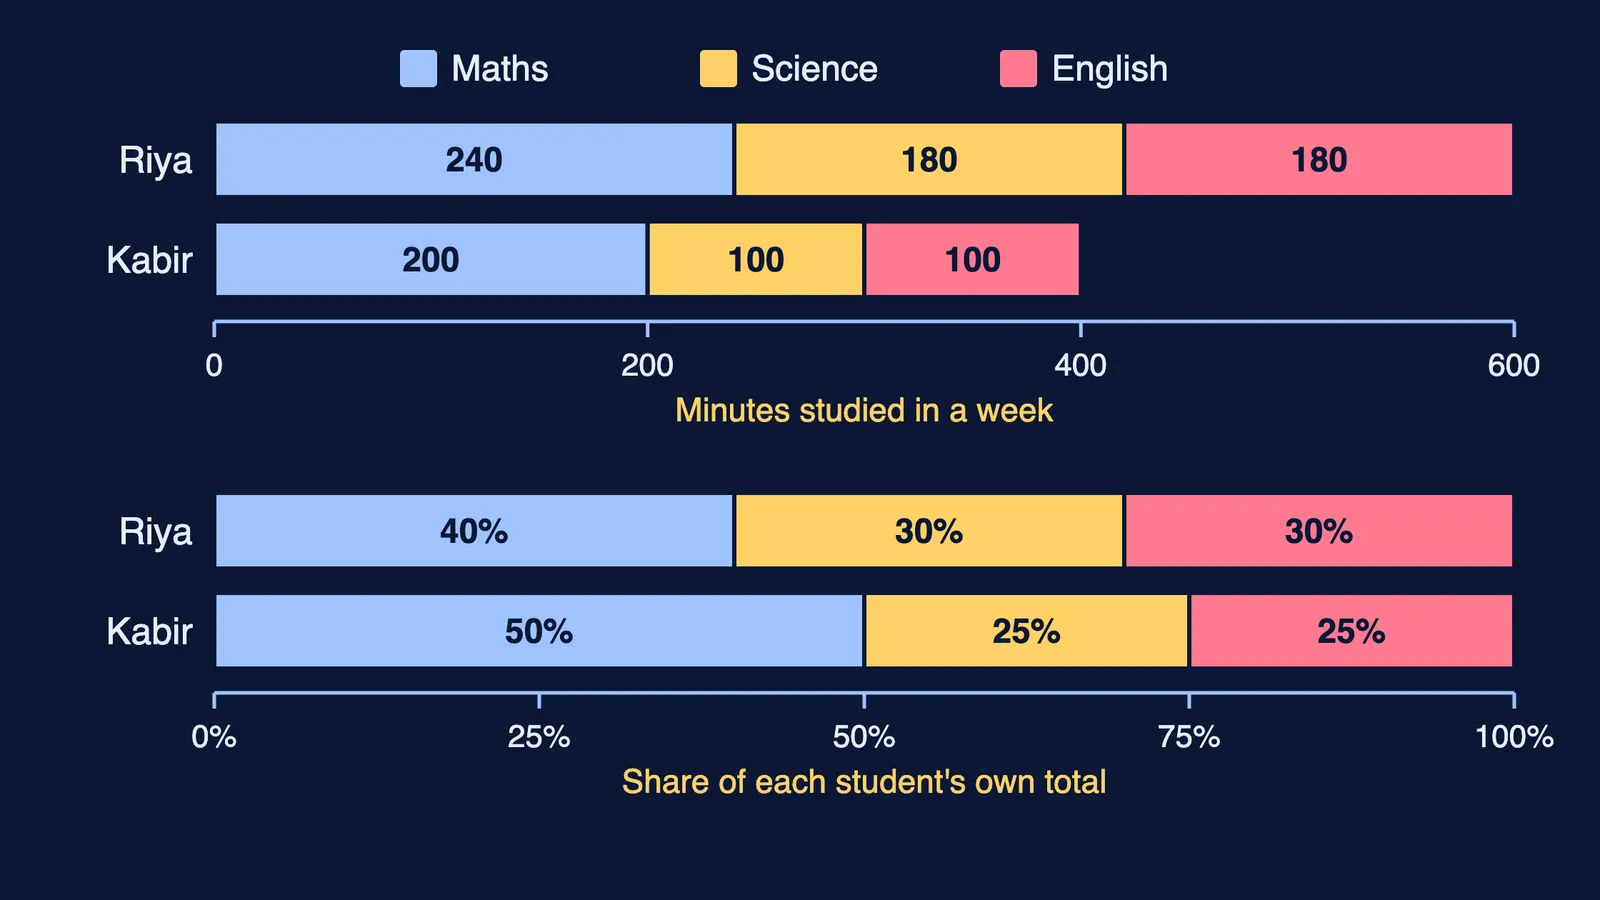
In a stacked bar chart, the full length of each bar is a total, and the coloured pieces are the parts that make it up (NCERT Chapter 10). In a 100% stacked bar chart, every bar has the same length and each piece shows its share of that bar's total.
The chart at the top uses made-up study logs. Riya studied 240 minutes of maths, 180 of science and 180 of English (600 in all); Kabir studied 200, 100 and 100 (400 in all). Converting: Riya's maths share is 240 ÷ 600 = 40%; Kabir's is 200 ÷ 400 = 50%.
So Kabir gives maths a bigger share, yet Riya studies more maths minutes. Both are true: a share says nothing about amount until you know the total.
For a refresher on plain side-by-side bars, see double bar graph comparison with gaps and percentage change.
What are the common mistakes in this chapter?
Averaging averages when the groups differ in size.
Dividing by the number of values instead of the sum of the weights.
Mixing marks out of different maximums: turn each into a percentage before weighting.
Reading a middle segment of a stacked bar from zero instead of measuring its length.
Comparing amounts across bars on a 100% chart, which only shows shares.
When a weighted mean goes wrong, the slip is usually in the method. The Fermi Problem Library has worked problems with a step-by-step solver that explains the reasoning rather than printing an answer, so you can see which step went astray.
How many marks is Statistics in CBSE Class 9 for 2026-27?
In the CBSE 2026-27 Class IX maths curriculum, Unit VI, Statistics and Probability, carries 10 of the 80 theory marks (CBSE curriculum 2026-27). Its learning outcomes name weighted averages, stacked and 100% stacked bar graphs, and interpreting mean, median and mode. For median and mode, our measures of central tendency guide covers the basics. The other half of Unit VI is probability, explained in our Class 9 Ganita Manjari probability guide.
Try these, then check:
On a bus, 25 students average 12 minutes of travel and 15 average 20 minutes. Find the combined average.
Mix 2 litres of drink that is 30% fruit with 3 litres that is 10% fruit. What percentage is fruit?
Shop P sold 120 pens out of 400 items; Shop Q sold 90 out of 200. Which shop has the larger pen share, and which sold more pens?
Answers: (1) (300 + 300) ÷ 40 = 15 minutes. (2) (0.6 + 0.3) ÷ 5 = 18%. (3) Q has the larger share (45% against 30%), but P sold more pens (120 against 90).