
On this page
Double bar graphs are where data handling turns from reading values to comparing them. Whether you are in Class 7 or revising for boards, the skill is the same: find the pair, find the gap, then decide whether the gap is big. That last step is the one that needs the most care.
What is a double bar graph?
A double bar graph shows two sets of data side by side, with one pair of bars for each category and a legend that tells you which colour belongs to which set. The categories sit on one axis (subjects, months, sections of a class) and the values sit on the other. Because both bars in a pair share the same scale, you can compare them by height before you do any arithmetic.
If single bar graphs still feel shaky, start with our guide to reading and drawing bar graphs. For when a double bar graph is the right tool at all, see how to choose the right graph for your data.
How do you read the difference between two bars?
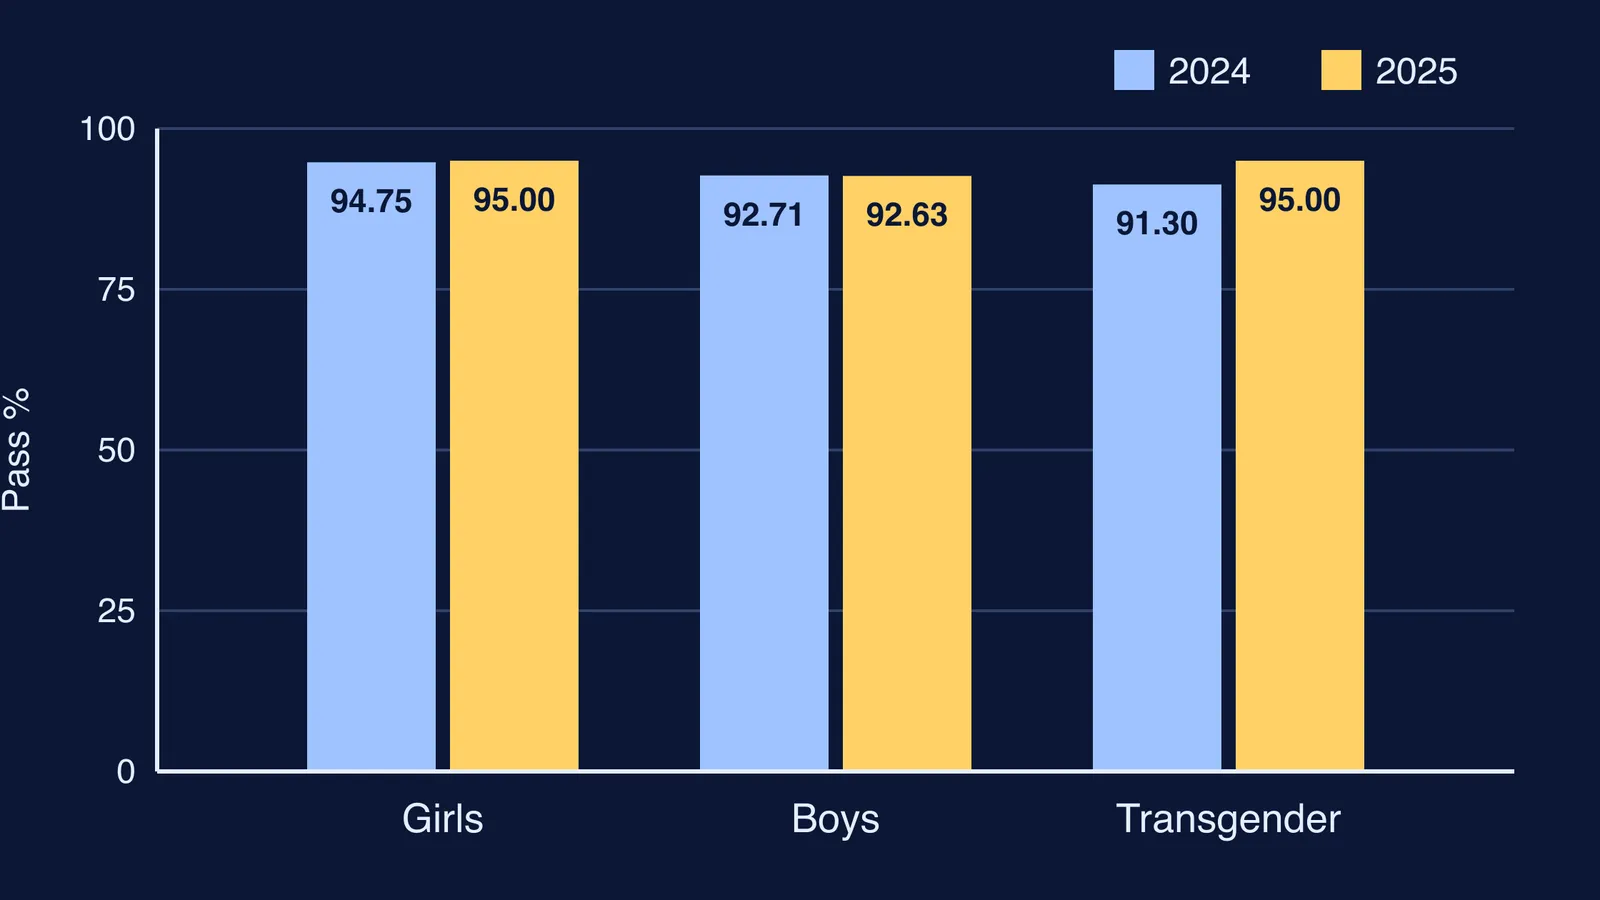
We will use real numbers, not made-up ones. The CBSE press release on the Class X 2025 result gives the pass percentage by gender for 2024 and 2025. That table is exactly what a double bar graph is built for: three categories, two years. The diagram at the top of this post draws it.
Girls: 94.75% in 2024, 95.00% in 2025
Boys: 92.71% in 2024, 92.63% in 2025
Transgender students: 91.30% in 2024, 95.00% in 2025
Reading a difference is one subtraction: later value minus earlier value. Girls went up by 0.25, boys went down by 0.08, and transgender students went up by 3.70. Keep the sign. A minus tells you the second bar is shorter, and a question may be testing whether you noticed.
You can also compare within one year instead of across years. For 2025, the release notes that girls did better than boys by 2.37 (95.00 minus 92.63).
How do you calculate percentage change from a double bar graph?
Percentage change = (new value − old value) ÷ old value × 100. The old value always goes on the bottom, because you are asking how big the change is compared with where you started.
Worked example, from the same CBSE Class X result statistics: 20,95,467 students passed in 2024 and 22,21,636 passed in 2025.
Difference: 22,21,636 − 20,95,467 = 1,26,169
Divide by the old value: 1,26,169 ÷ 20,95,467 ≈ 0.0602
Multiply by 100: about 6.02% more students passed
Now try it on the bars in the diagram. For transgender students, 3.70 ÷ 91.30 × 100 ≈ 4.05%, a rise. For boys, 0.08 ÷ 92.71 × 100 ≈ 0.09%, a fall. Notice that the biggest gap on the graph also gives the biggest percentage change here, but only because the starting values are close to each other. When the starting values differ a lot, the same gap can mean very different percentage changes.
Why is a change in percentage not the same as percentage change?
This is a common trap. The CBSE table shows the overall pass percentage moving from 93.60 in 2024 to 93.66 in 2025, and reports it as an increase of 0.06%. Strictly, that is 0.06 percentage points: the gap between two percentages. The percentage change in the pass rate is 0.06 ÷ 93.60 × 100, roughly 0.064%.
So two things are true at once: about 6% more students passed, and the pass rate barely moved. More students also appeared, 22,38,827 in 2024 and 23,71,939 in 2025, roughly 5.95% more. The number passing grew almost in step with the number writing the exam. A double bar graph of counts would show every 2025 bar taller; a double bar graph of pass rates would look nearly flat. Same exam, different story, depending on what is plotted.
For more practice with this distinction, see our explainer on percentage points versus percent change.
A five-step checklist for double bar graph questions
Read the title, both axes and the legend. Say aloud what each colour stands for.
Check where the scale starts and what one gridline is worth.
For each pair, write both values in your rough work before calculating.
For a difference, subtract and keep the sign. For percentage change, divide by the old value.
Finish with one sentence in words, such as: boys' pass percentage fell slightly from 2024 to 2025.
If an answer comes out wrong and you cannot see where, the Fermi Problem Library has worked problems with a step-by-step solver that explains the reasoning rather than printing an answer. For the idea of percentages itself, the Fermi Concept Library gives each mathematics concept its own lesson.
Next time you see two bars side by side, in a textbook or a newspaper, run all five steps on it.