On this page
A bar graph looks easy until you sit down with graph paper and a list of numbers like 45, 72, 38, 90 and 15. Here is one worked example you can copy, following Chapter 4 of the NCERT Class 6 maths textbook Ganita Prakash, plus a routine for reading values back.
What does the scale of a bar graph mean?
The scale tells the reader how much one unit of length stands for. In the NCERT textbook, a graph of absent students uses "1 unit length = 1 student", a traffic graph uses one unit of length for 100 vehicles, and a graph of India's population uses 1 unit for 10 crores.
The same textbook says bars should have uniform width, be drawn horizontally or vertically with equal spacing between them, and have a length or height that represents the given number. Only the bar's length carries information, so every bar should look the same apart from its height.
How do you choose a sensible scale?
NCERT's advice is to decide how many items a unit length of a bar will represent "so that it fits nicely on our paper". Three steps do it:
Find the largest value in your data.
Measure how much space you have on the value axis (say 10 cm).
Divide the largest value by that length, then round up to a friendly number: 1, 2, 5, 10, 20, 50, 100 and so on.
Friendly numbers matter because you will read the graph back later. Reading 72 on a scale of 1 cm = 10 is easy. Reading it on 1 cm = 9 is not.
How do you draw a bar graph step by step?
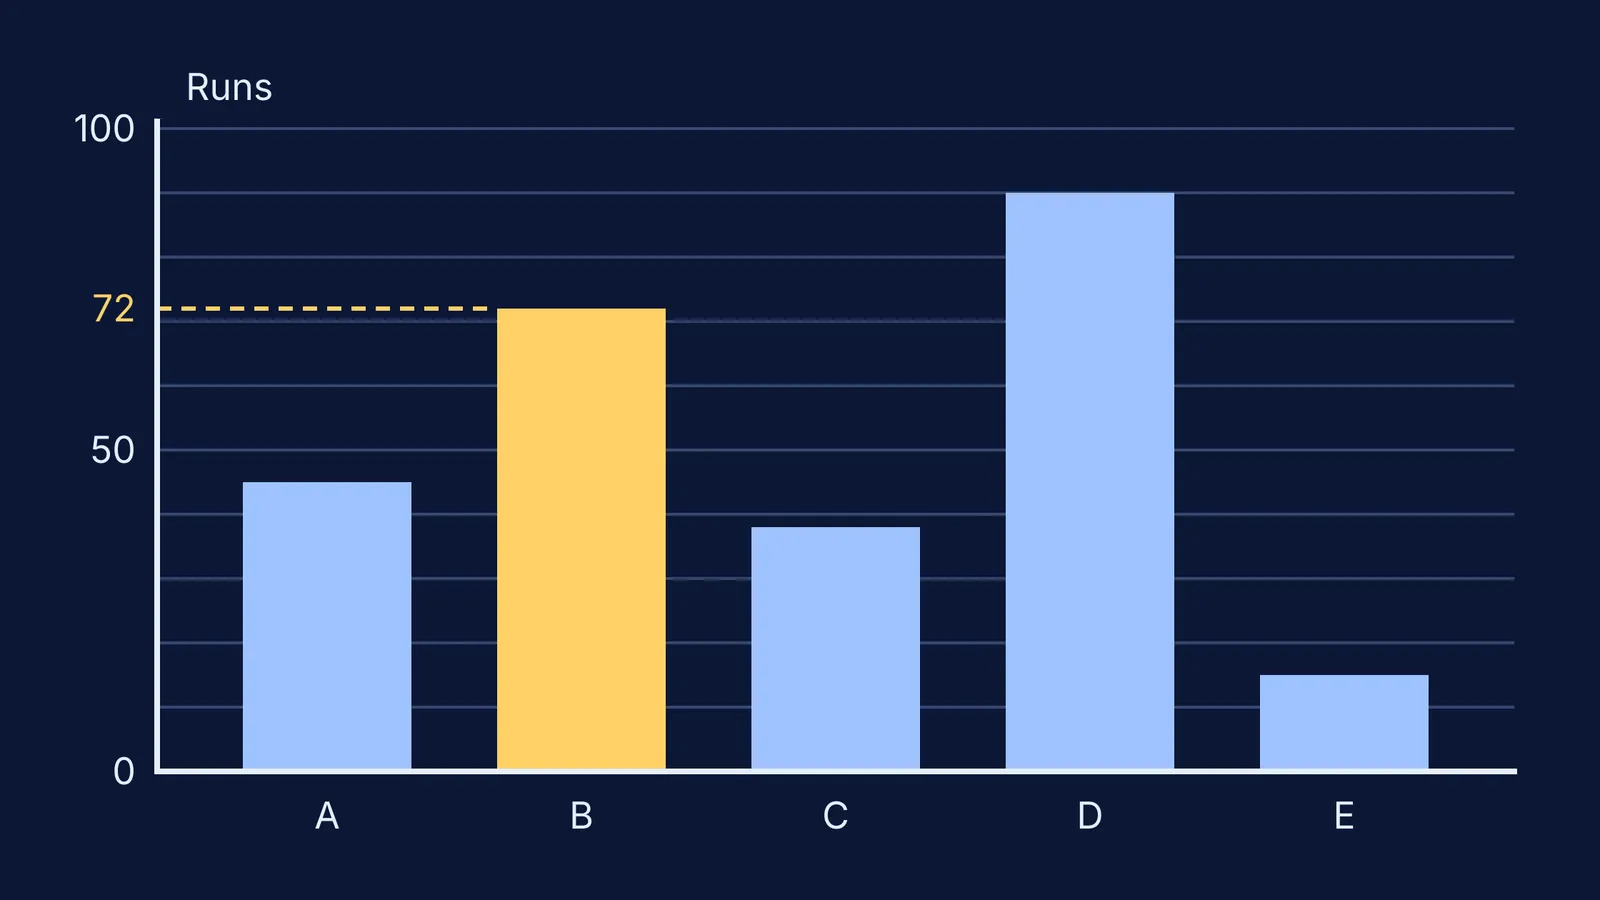
Here is a made-up example. In an inter-house cricket match, five batters scored: Aarav 45, Bina 72, Chetan 38, Divya 90 and Esha 15. You have 10 cm of height on your graph paper.
Largest value: 90. Then 90 divided by 10 cm is 9 runs per cm, so round up to 1 cm = 10 runs.
Check the alternatives. 1 cm = 5 runs would need an 18 cm bar, which does not fit; 1 cm = 20 runs gives a cramped tallest bar of 4.5 cm.
Bar heights at 1 cm = 10 runs: Aarav 4.5 cm, Bina 7.2 cm, Chetan 3.8 cm, Divya 9 cm, Esha 1.5 cm.
Now draw it:
Draw the horizontal and vertical axes. Mark 0 where they meet.
Mark the value axis every 1 cm: 0, 10, 20 and so on up to 90 or 100.
Write the scale in a corner: 1 cm = 10 runs.
Choose one bar width (1 cm) and one gap (1 cm), including the gap before the first bar.
Draw each bar from the zero line up to its height, and write the batter's name under it.
Label both axes (Batters, Runs scored) and give the graph a title.
How do you read a value from a bar graph correctly?
Don't guess by eye. Use this routine instead:
Read the scale first. Know what one unit and one small square stand for.
Place a ruler flat across the top of the bar so it meets the value axis.
Find the labelled line just below, then count small squares up from it. In our example, Bina's bar ends 2 mm above the 70 line; at 1 cm = 10 runs each mm is 1 run, so she scored 72.
If the bar ends between marks, say "about". NCERT does this in its traffic example, where a bar reads "about 150 vehicles" on a scale of 100 per unit.
For comparisons, subtract the values, not the bar lengths in cm. Divya scored 90 and Esha 15, so the difference is 75 runs.
Why should the value axis start at zero?
Because readers judge a bar by its length. If the axis starts at, say, 30 instead of 0, a small difference suddenly looks huge.
In five studies, Brenda Yang and colleagues found that a truncated y-axis made viewers see differences as larger, with 83.5% of participants showing the effect (Journal of Applied Research in Memory and Cognition, 2021). The effect persisted even after viewers were taught about truncated axes (abstract, Duke Scholars). So when you draw, start at zero. When you read graphs in news or on social media, check where the axis begins.
What should you practise next?
Take a small table from your textbook, cover the given graph, and draw your own. Swap with a friend and read each other's values. If the idea of a scale still feels shaky, the Fermi Concept Library covers every concept in mathematics, each with its own lesson and its place in the map. For mixed practice, the Fermi Problem Library has worked problems with a step-by-step solver that explains the reasoning rather than printing an answer.