
On this page
Class 7 maths uses NCERT's new Ganita Prakash, Part II (book code gegp2, First Edition, October 2025). Chapter 5, "Connecting the Dots...", starts on page 97, per the contents page. CBSE publishes no separate 2026-27 curriculum for Classes 6 to 8; they follow the NCERT book, and the chapter is assessed by the school. All examples below use our own numbers.
What does Connecting the Dots cover in Class 7 maths?
The chapter runs in this order:
statistical statements and statistical questions (ones you answer by collecting data)
the average, or arithmetic mean, seen as a fair share
dot plots, outliers and the median
mean and median as measures of central tendency, read with the minimum and maximum
zero versus no value
clustered (double) bar graphs and a 2-step way to read graphs
"Data Detective": new questions from data
In the chapter, the mean is the sum of all values divided by the number of values. The median is the middle number of the sorted data; with an even count, take the mean of the middle two.
A note on mode: the About the Book page in the prelims says the chapter introduces mean, median and mode, but the chapter text teaches only mean and median. If your school covers mode too, our Class 7 mode and median guide explains it.
How do you find the mean and median? A worked example
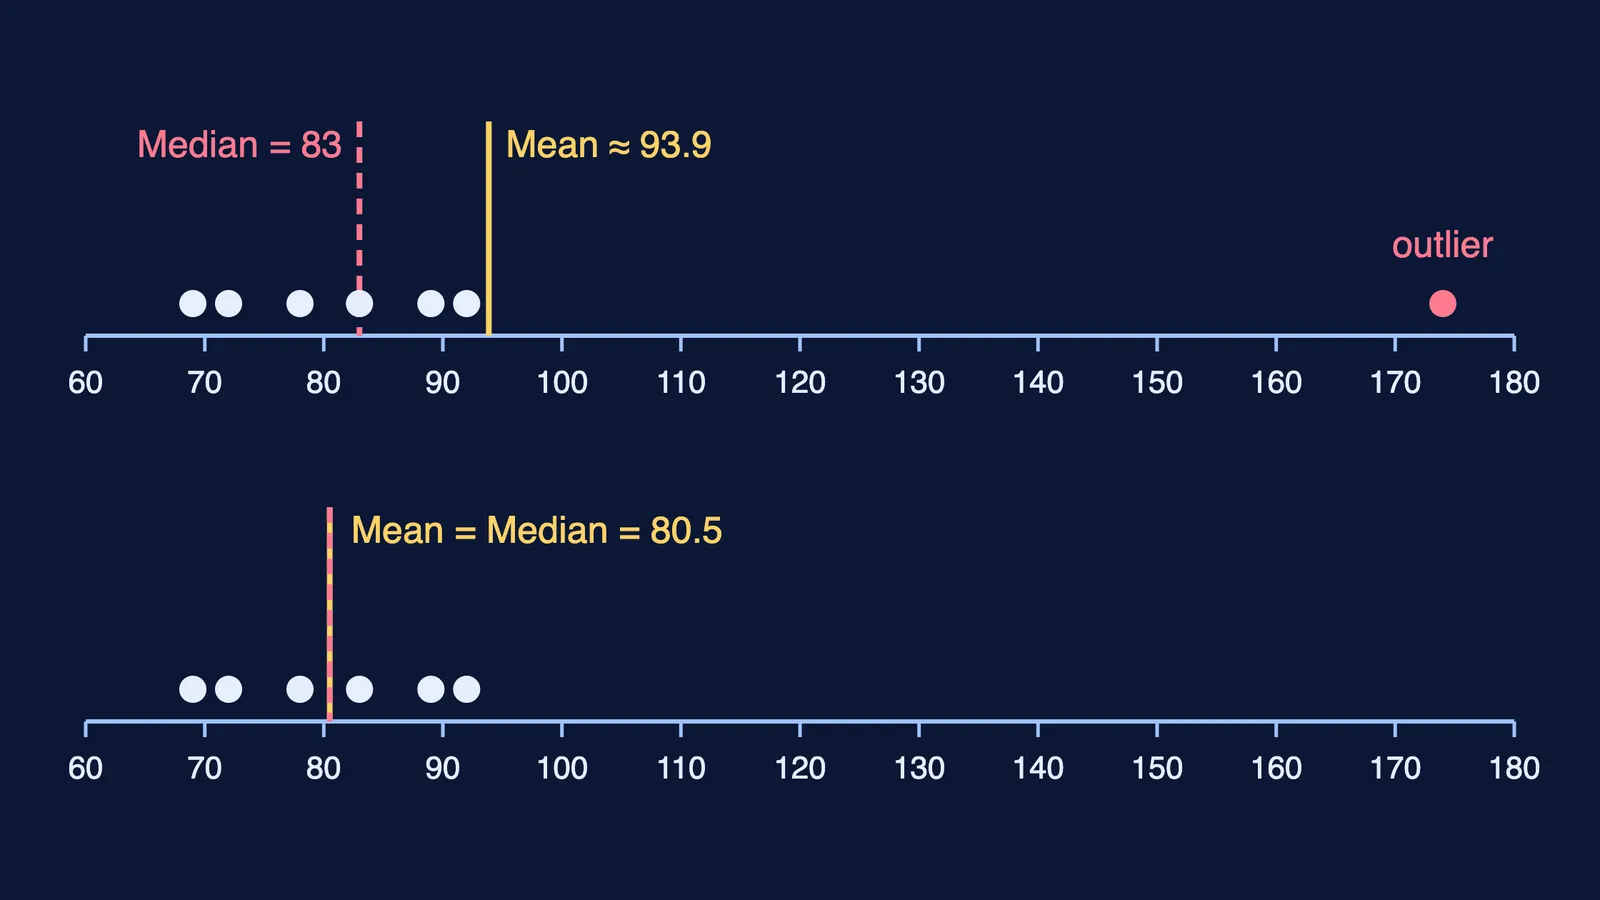
Tara counts birds at a lake for 7 mornings: 83, 69, 92, 78, 72, 89, 174. A flock came on the last morning.
Total: 83 + 69 + 92 + 78 + 72 + 89 + 174 = 657.
Mean: 657 ÷ 7 ≈ 93.86, about 93.9 birds a morning.
Sort: 69, 72, 78, 83, 89, 92, 174.
Median: with 7 values, the 4th one: 83 birds.
Six of seven mornings fall below the mean, so the median describes a usual morning better (top dot plot above).
Why does an outlier pull the mean but not the median?
The chapter calls a value far from the rest an outlier (NCERT Chapter 5). The mean uses the total, so one extreme value shifts it. The median depends only on the middle position, so it barely moves.
Drop the 174: 483 ÷ 6 = 80.5. The sorted six values are 69, 72, 78, 83, 89, 92, so the median is (78 + 83) ÷ 2 = 80.5. Mean and median now match, as the lower dot plot shows.
One more trap from the chapter: 0 is a real value, but a missing day is not. If Tara skipped counting one morning, divide by the mornings she counted.
How do you read a double bar graph?
A clustered column graph draws two bars side by side for each category, in different colours; with two per cluster, the book also calls it a double column graph (NCERT Chapter 5). Patterns inside bars help readers who cannot easily tell colours apart, and black-and-white prints.
The chapter's 2-step method:
Identify what is given: the axes, the scale (what one unit of length stands for) and any pattern.
Infer from what is given: turn each observation into a statement the data really supports.
The summary also lists the range; our guide to the range of data shows why one extreme value moves it.
Practice questions
Mark values are our suggestion.
(1 mark) Which is a statistical question? (a) When does our school start? (b) How many minutes do students in our class take to walk to school? Answer: (b); answers vary and need data.
(2 marks) Four friends share 69, 82, 88 and 89 marbles equally. How many each? Answer: 328 ÷ 4 = 82.
(2 marks) Find the mean and median of six seedling heights: 88, 69, 92, 77, 89, 83 (mm). Answer: mean = 498 ÷ 6 = 83 mm; sorted 69, 77, 83, 88, 89, 92, median = (83 + 88) ÷ 2 = 85.5 mm.
(3 marks) A batter scores 72, 0, did not play, 89, 82. Find the mean and median per match played. Answer: 243 ÷ 4 = 60.75 runs; sorted 0, 72, 82, 89, median (72 + 82) ÷ 2 = 77 runs. Dividing by 5 is wrong.
(3 marks) In five quiz rounds, Team X scores 183, 185, 181, 184, 182 and Team Y scores 192, 191, 69, 193, 190. Compare them. Answer: X: mean 915 ÷ 5 = 183, median 183. Y: mean 835 ÷ 5 = 167, median 191; the low outlier 69 drags the mean down.
How does Chapter 5 link to the rest of Ganita Prakash?
The graph section recalls data graphs met the year before, in Class 6. Means are often decimals, so Chapter 4's decimal division ("Another Peek Beyond the Point", per the contents) is used at once, as in 93.86. In Class 9, the mean grows into the weighted mean: see How Quantities Combine in Ganita Manjari.
Not sure which part of data handling to revise first? Fermi's AI tutor works out what you already know and builds a plan for the session.