On this page
Range is the first measure of spread you meet in school maths, and it is the quickest to work out. It also has one weakness you should understand, because exam questions like to test it.
What is the range of data?
The range is the largest value minus the smallest value in a data set, as the NIST/SEMATECH e-Handbook of Statistical Methods defines it. NCERT's Class 11 Statistics chapter writes the same idea as a formula: Range of a series = Maximum value − Minimum value.
That is it. No adding up, no dividing. You need just two numbers from the data: the highest and the lowest.
How do you find the range, step by step?
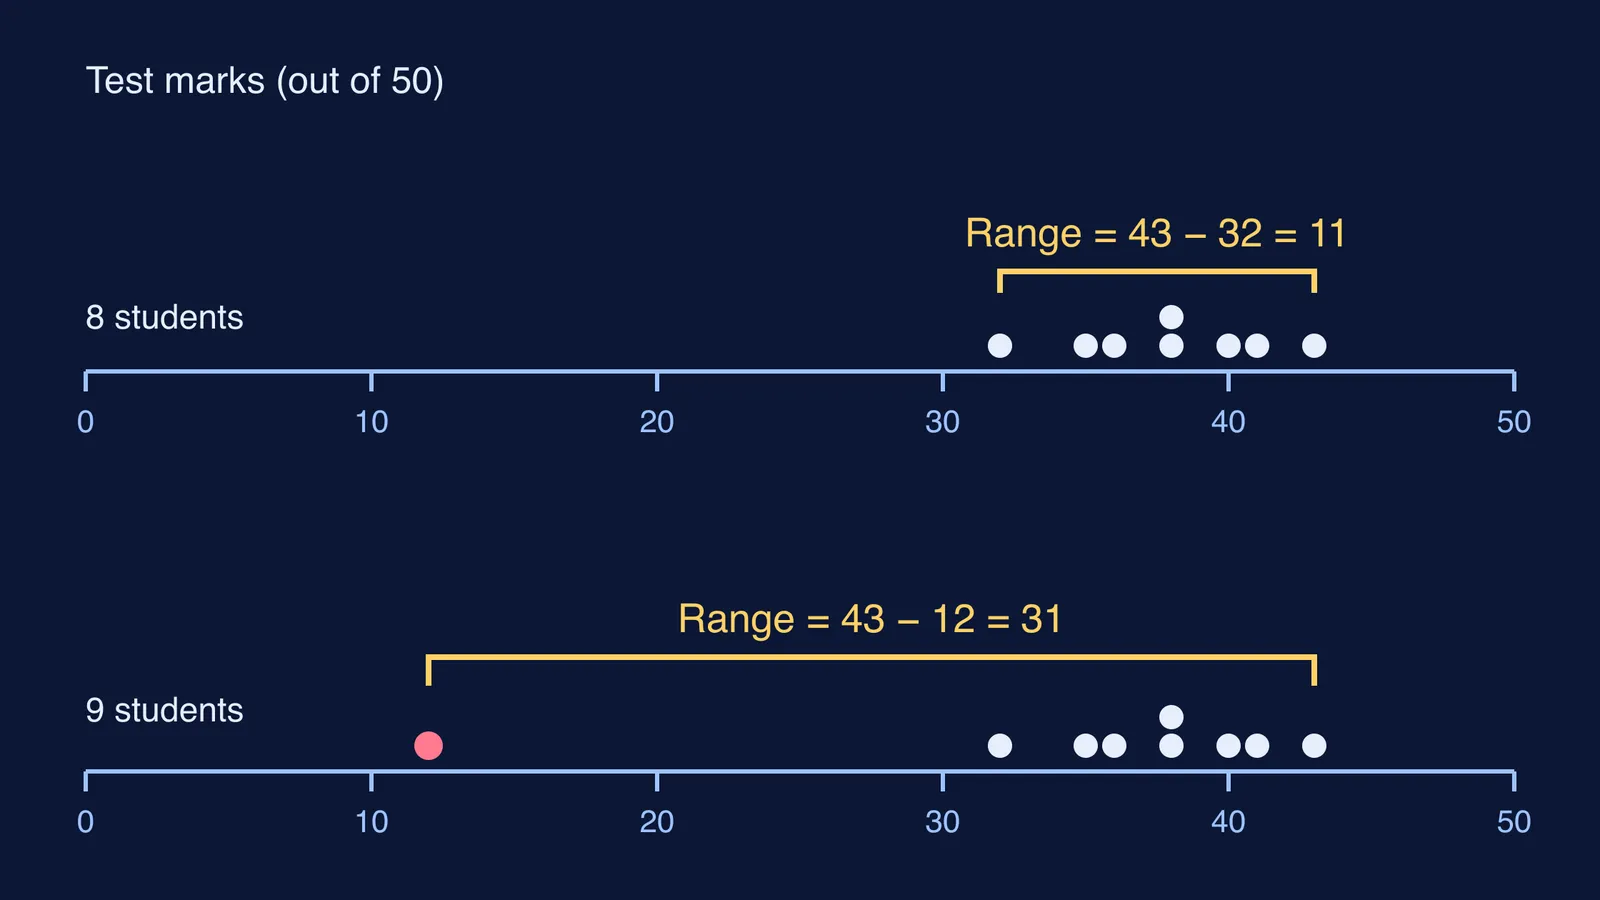
Say eight students took a class test out of 50 and scored: 38, 32, 41, 36, 43, 35, 40, 38.
Write the marks in order: 32, 35, 36, 38, 38, 40, 41, 43.
Pick the highest (43) and the lowest (32).
Subtract: 43 − 32 = 11. The range is 11 marks.
Keep the unit. If the data is in marks, the range is in marks; if it is in kilograms, the range is in kilograms. Sorting first is not strictly needed, but it stops you from missing a value hiding in the middle of a long list.
What does the range tell you about spread?
An average tells you where the data sits. The range tells you how wide it stretches. NCERT's Statistics chapter shows why you need both. Two batsmen each scored runs in ten matches, and both have a mean of 53 and a median of 53.
Batsman A: 30, 91, 0, 64, 42, 80, 30, 5, 117, 71. Range = 117 − 0 = 117.
Batsman B: 53, 46, 48, 50, 53, 53, 58, 60, 57, 52. Range = 60 − 46 = 14.
Same average, very different players. Batsman B is steady; Batsman A swings from a duck to a century. The chapter concludes that the scores are scattered in the case of A, while for B they are close to each other.
If you want a refresher on the averages that sit alongside range, see our guide to mode and median of ungrouped data for Class 7.
Why does one extreme value change the range so much?
Because the range is built from only two values. The NIST handbook notes that the range is based only on the lowest and highest extreme values in the sample, so the spread near the centre of the data is not captured, and it advises caution in using the range for large data sets.
Go back to the class test. A ninth student, who was unwell on the day, scored 12. Now compare before and after:
Range: 43 − 32 = 11 becomes 43 − 12 = 31. It nearly triples.
Median: 38 before, still 38 after (the middle value of 12, 32, 35, 36, 38, 38, 40, 41, 43).
Mean: 303 ÷ 8 ≈ 37.9 becomes 315 ÷ 9 = 35. It moves, but by less than 3 marks.
None of the eight original marks changed, yet the range now says the class is spread nearly three times as wide. That is the key idea: the range reacts fully to an extreme value, the mean reacts partly, and here the median does not move at all.
This is also why statisticians use other measures of spread. NCERT notes that the range gives a rough idea of variability but does not tell you how the data is spread around the centre (NCERT). Our explainer on why range is a poor measure of dispersion goes further, and when to use the median instead of the mean shows the same effect on averages.
What mistakes do students make with range?
Run through this checklist before you write the final answer:
Did you subtract lowest from highest, not first from last in the list as given?
Is your answer positive? A range can be 0 (all values equal) but never negative.
Did you include every value, including a 0 or a repeated number?
Did you write the unit (marks, runs, cm)?
If the question asks what the range shows, did you mention that one extreme value can make it misleading?
For practice, try a few data sets of your own: find the range, then change only the largest value and find it again. If you want worked problems with a step-by-step solver that explains the reasoning rather than printing an answer, the Fermi Problem Library has them, and the Fermi Concept Library has its own lesson for every concept in mathematics.