

On this page
When students encounter data handling in Class 7 mathematics, they are introduced to representative values. These values allow us to take a large, messy list of numbers and summarize them into a single, meaningful figure. While the arithmetic mean (or average) is widely known, the mode and median are equally important tools for understanding ungrouped data. They give us different ways to look at what is typical or central in a set of information.
What are mode and median of ungrouped data?
Ungrouped data is simply a raw, unorganized list of numbers. This could be the marks scored by students in a weekly test, the daily temperatures over a month, or the shoe sizes of a sports team. Before we group this data into frequency tables, we can analyze it in its raw form.
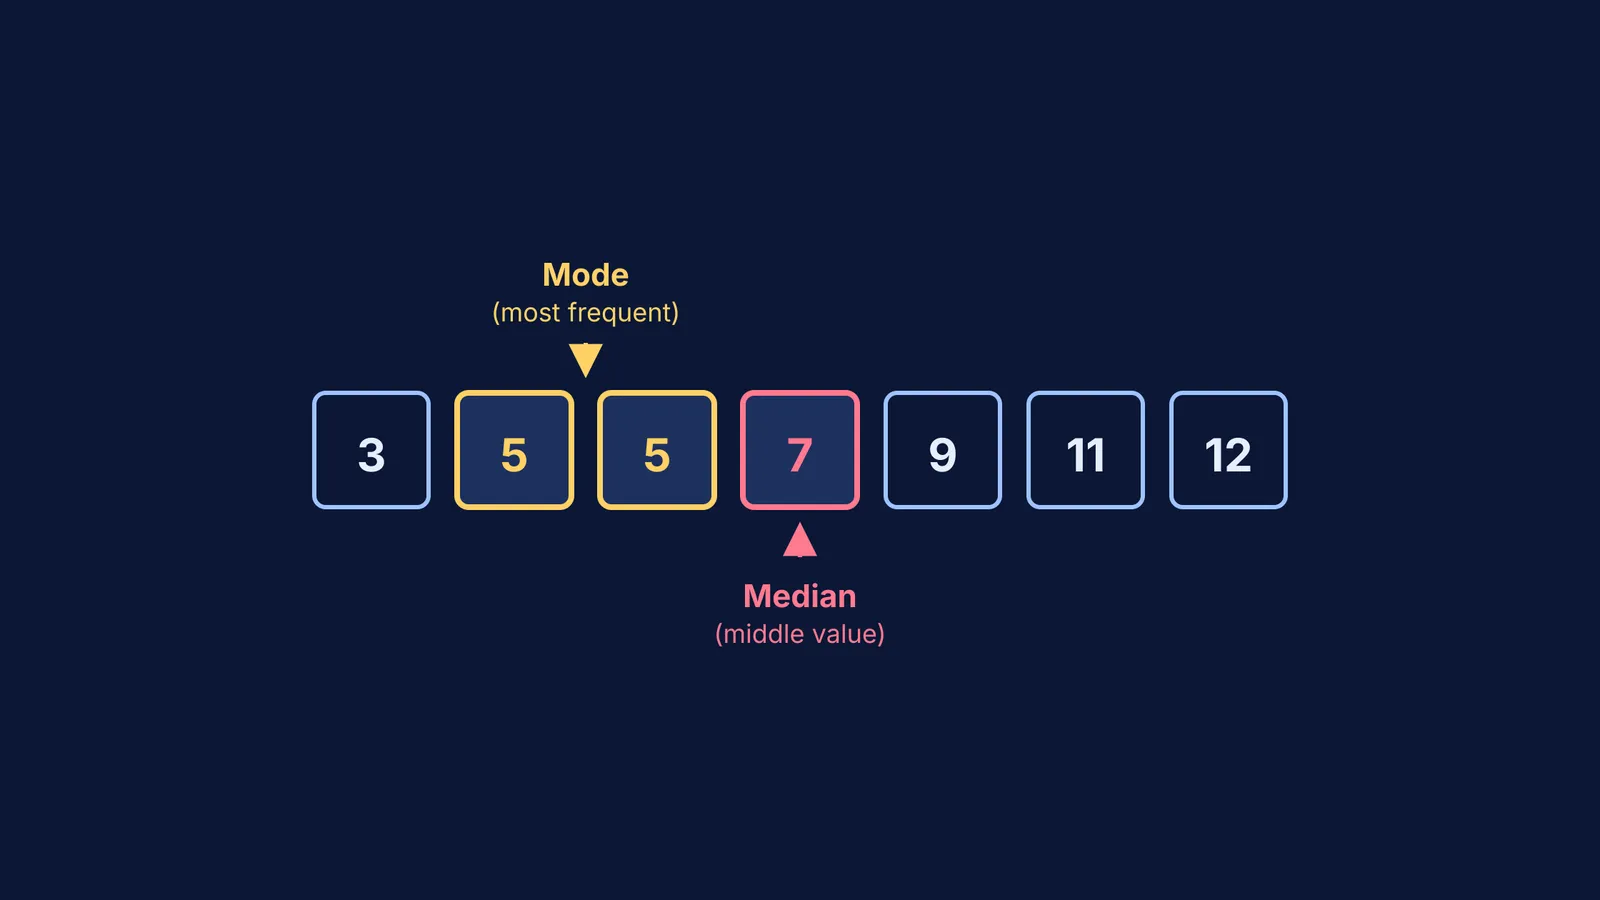
The mode is the value that appears most often in a set of data values (Wikipedia)). It tells you the most common occurrence in your list. For example, if a store wants to know which shirt size to restock, they care about the mode.
The median is the value separating the higher half from the lower half of a data sample, acting as the "middle" value (Wikipedia). It gives you the exact geometric center of the sorted dataset.
For quick reference on formal definitions while tackling homework, the Fermi Concept Library explains every concept in mathematics.
Why use median and mode instead of the mean?
A common question is why we need three different ways to find a "middle" value. The answer depends on the shape of the data.
The mean is sensitive to outliers. If five students score 12, 14, 15, 15, and 95 on a test, the one unusually high score (95) pulls the average up significantly, making the class look like they performed better overall than they actually did.
The median ignores these extremes. In the sorted list (12, 14, 15, 15, 95), the middle value is 15. This accurately reflects that most students scored around 14 or 15. The median is robust against extreme values.
The mode is unique because it is the only measure of central tendency that works with non-numerical categories. If you survey the favourite colours of your class, you cannot average "blue" and "red", but you can find the mode by seeing which colour was chosen the most.
How do you find the median of odd and even observations?
Finding the exact middle value mathematically depends on how many numbers (n) are in your list.
For an odd number of observations: When your dataset has an odd number of items, there is a single, clear number in the middle.
Example: Consider the test scores 12, 15, 11, 14, 18.
Arrange them in ascending order: 11, 12, 14, 15, 18.
Since there are 5 observations, the 3rd number sits perfectly in the center, with two numbers below it and two above it.
The median is 14.
For an even number of observations: When the count is even, there is no single middle number. Instead, the median is defined as the arithmetic mean of the two middle values (Wikipedia).
Example: Consider the scores 7, 9, 12, 14, 15, 18.
The data is already sorted.
Since there are 6 observations, the two middle numbers are the 3rd and 4th values: 12 and 14.
Calculate their average: (12 + 14) / 2 = 13.
The median is 13.
If you struggle with choosing the correct formula for different datasets, Fermi's AI tutor can work out what you already know and build a plan for the session, guiding you through the logic step by step.
What happens when a data set has two modes?
A dataset does not always have just one clear "winner" for the most frequent item. If two different numbers appear the exact same maximum number of times, the dataset is called "bimodal". Both numbers are considered modes.
Example: In the dataset 3, 5, 5, 7, 9, 9, 11, the numbers 5 and 9 both appear twice. Since no other number appears more than twice, both 5 and 9 are the modes of this data.
There are also cases where no number repeats at all. If every number appears exactly once, the dataset simply has no mode. You do not write "zero" as the mode, because 0 is a specific numerical value.
A step-by-step framework for exam questions
When faced with an ungrouped data problem in your Class 7 exam, follow this reliable checklist to avoid careless mistakes:
Count the observations: Write down the total number of items (n). Knowing whether n is odd or even tells you exactly how to approach the median.
Arrange the data: Sort the numbers in ascending order immediately on your rough sheet. This is a strict requirement for the median and helpful for visualizing the mode.
Find the mode: Look for the longest streak of repeating numbers. If two streaks tie, write both down.
Find the median: Pick the exact middle number if n is odd. If n is even, circle the two middle numbers, add them together, and divide by 2.
When practicing these steps at home, the Fermi Problem Library has worked problems with a step-by-step solver that explains the reasoning rather than printing an answer, making it easy to check your method and build confidence.


