

On this page
In statistics, dispersion tells us how spread out a set of numbers is. A low dispersion means the data points are clustered closely together around a central value, while a high dispersion means they are scattered widely across a broad spectrum.
The simplest way to measure this spread is the range. The range of a set of data is calculated simply as the difference between the largest and smallest values 1). While it is easy to understand and calculate, relying on range alone can give you a very misleading picture of your data.
Why does range misrepresent data?
The fundamental limitation of range is that it depends entirely on just two numbers: the two extreme values at either end of your dataset. It completely ignores every single data point in between those two boundaries.
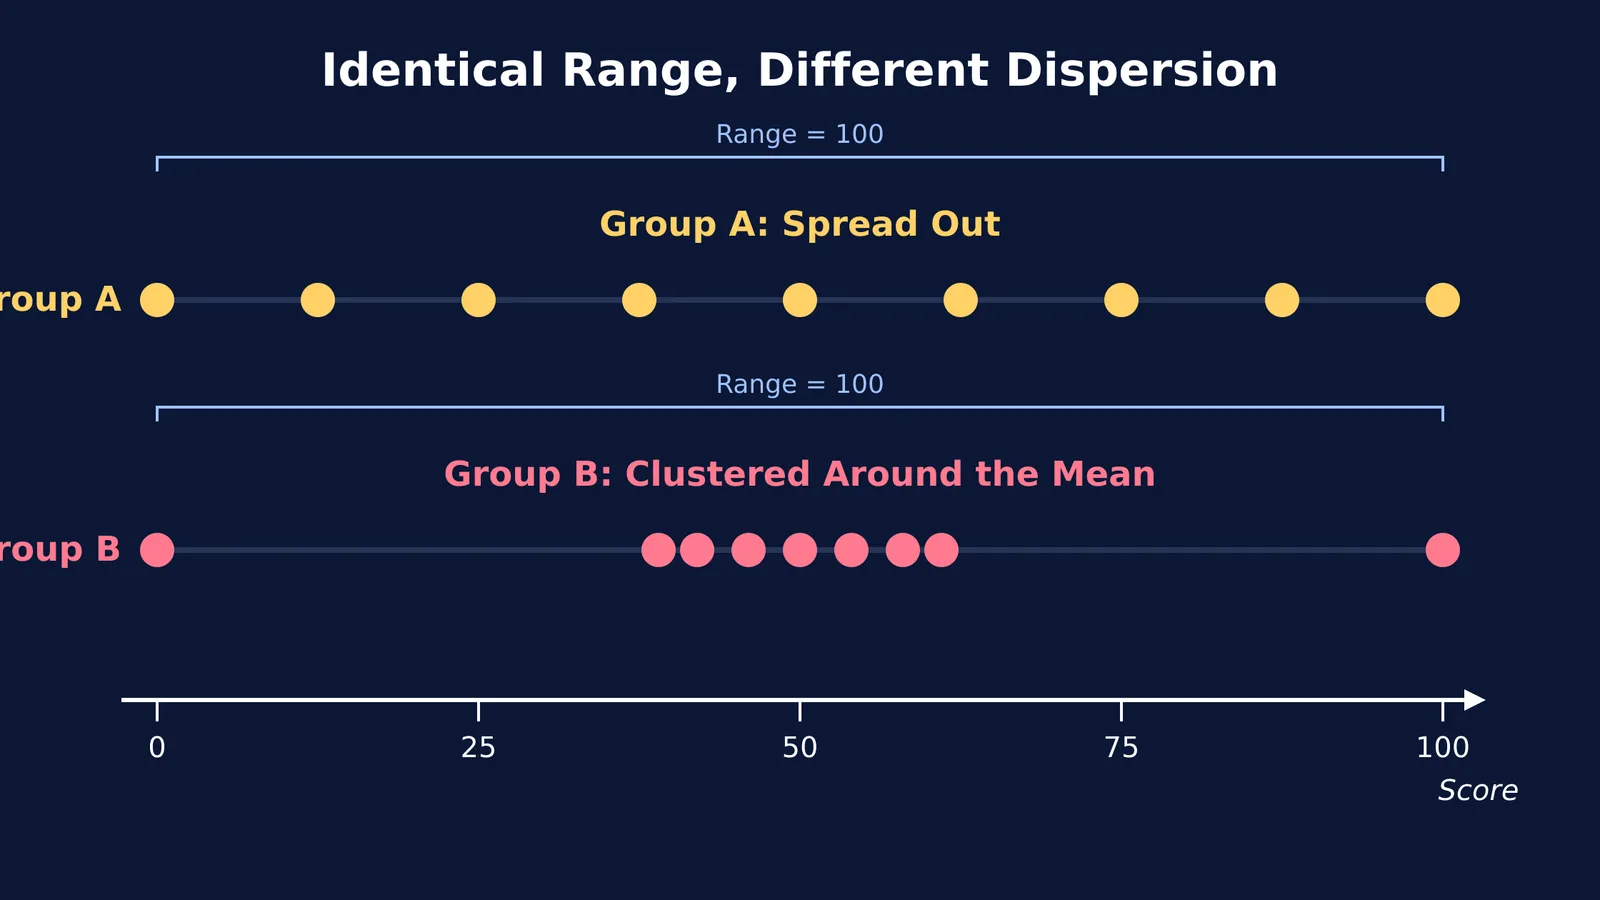
Imagine two groups of students taking a test marked out of 100.
Group A scores: 0, 12.5, 25, 37.5, 50, 62.5, 75, 87.5, 100. Group B scores: 0, 39, 42, 46, 50, 54, 58, 61, 100.
For both groups, the maximum score is 100 and the minimum is 0, so both have an identical range of 100. If you only look at the range, you might assume both groups performed similarly and have the same level of consistency. However, the scores in Group B are heavily clustered around the middle (50), with just two extreme outliers pulling the range wide. Group A's scores are genuinely spread out evenly across the entire spectrum. The range fails to distinguish between these two very different situations.
When exploring these mathematical ideas in the Fermi Concept Library, you can see how focusing on just the extremes hides the true shape of a distribution.
How do outliers affect the range?
Because it only uses the highest and lowest numbers, range is extremely sensitive to outliers—data points that differ significantly from other observations.
Consider the Joint Entrance Examination (JEE) Main. In Paper 1, the maximum possible score is 300, and due to negative marking for incorrect answers, scores can mathematically drop below zero, giving a theoretical minimum of -75 2. This gives a massive theoretical range of 375.
If one student scores a perfect 300 and another scores -75, the range for the entire applicant pool is stretched to 375, even if the vast majority of other candidates scored tightly between 50 and 150. A single unusual result dictates the measure for the entire group, ignoring the dense cluster of typical scores. This extreme sensitivity makes range a poor choice for serious statistical analysis, as it fluctuates wildly from one sample to another based solely on anomalies.
What do mean deviation and standard deviation fix?
To get a true picture of dispersion, you need a measure that takes every single data point into account. This is where mean deviation and standard deviation come in.
Rather than just looking at the edges, these methods measure how far, on average, each piece of data is from the centre (the mean). The standard deviation measures how far data values are from their mean and is zero only if all values are exactly identical 3. By squaring the distances, it strongly penalises scores that are very far from the average.
If we revisit our test score example from earlier:
Find the mean: For both Group A and Group B, the mean average is exactly 50.
Find the deviations: Calculate how far each score is from 50, ignoring whether it is above or below (the absolute deviation).
Average the deviations: For Group A, the mean absolute deviation is 27.8. For Group B, it is only 16.2.
By including the "missing middle", mean deviation correctly identifies that Group A is far more dispersed than Group B, even though their ranges are identical. For more complex calculations involving scaling, you can see how adding to or scaling data changes the mean and variance.
Which measure of dispersion should you use?
When you are analysing test results, scientific lab data, or any large set of numbers, do not rely on the range alone to tell you about consistency. It is only the first step in understanding a dataset.
Use this quick checklist to decide which measure to use for your specific problem:
Do you need a rough, instant estimate? Use the range. It is useful for quick checks, like daily temperature fluctuations or checking if sensor readings are within a safe operating window.
Are there extreme outliers in your data? Avoid the range. Look into the interquartile range (IQR), which measures only the middle half of the data and ignores the extremes entirely.
Do you need to know how consistently the data clusters around the average? Calculate the mean absolute deviation. You can practice finding the mean absolute deviation about the median, worked for JEE.
Are you doing further statistical analysis? Use the standard deviation. It has the strong algebraic properties required for advanced maths, such as calculating confidence intervals or working with normal distributions.
When you use Fermi's AI tutor to practice statistics, you will see how moving past the range to standard deviation gives you a much sharper tool for understanding variability.


