

On this page
Imagine a college says its graduates earn an average of 9.8 lakh a year. That sounds great until you learn that most of the batch earned between 4 and 7 lakh and one student got 45. The average isn't a lie, but it doesn't describe a typical graduate. Here is when to switch to the median, and how to explain why in an exam.
What is the difference between mean and median?
The mean is "the sum of the data points divided by the number of data points", according to the NIST/SEMATECH e-Handbook of Statistical Methods.
The median is the value that has half the data smaller than it and half the data larger, in the same NIST handbook.
To find the median, sort the values and take the middle one. If there are an even number of values, average the middle two (we explain this step in finding the median when the number of observations is even). The mean uses the size of every value. The median only uses their order.
Why do outliers and skewed data pull the mean?
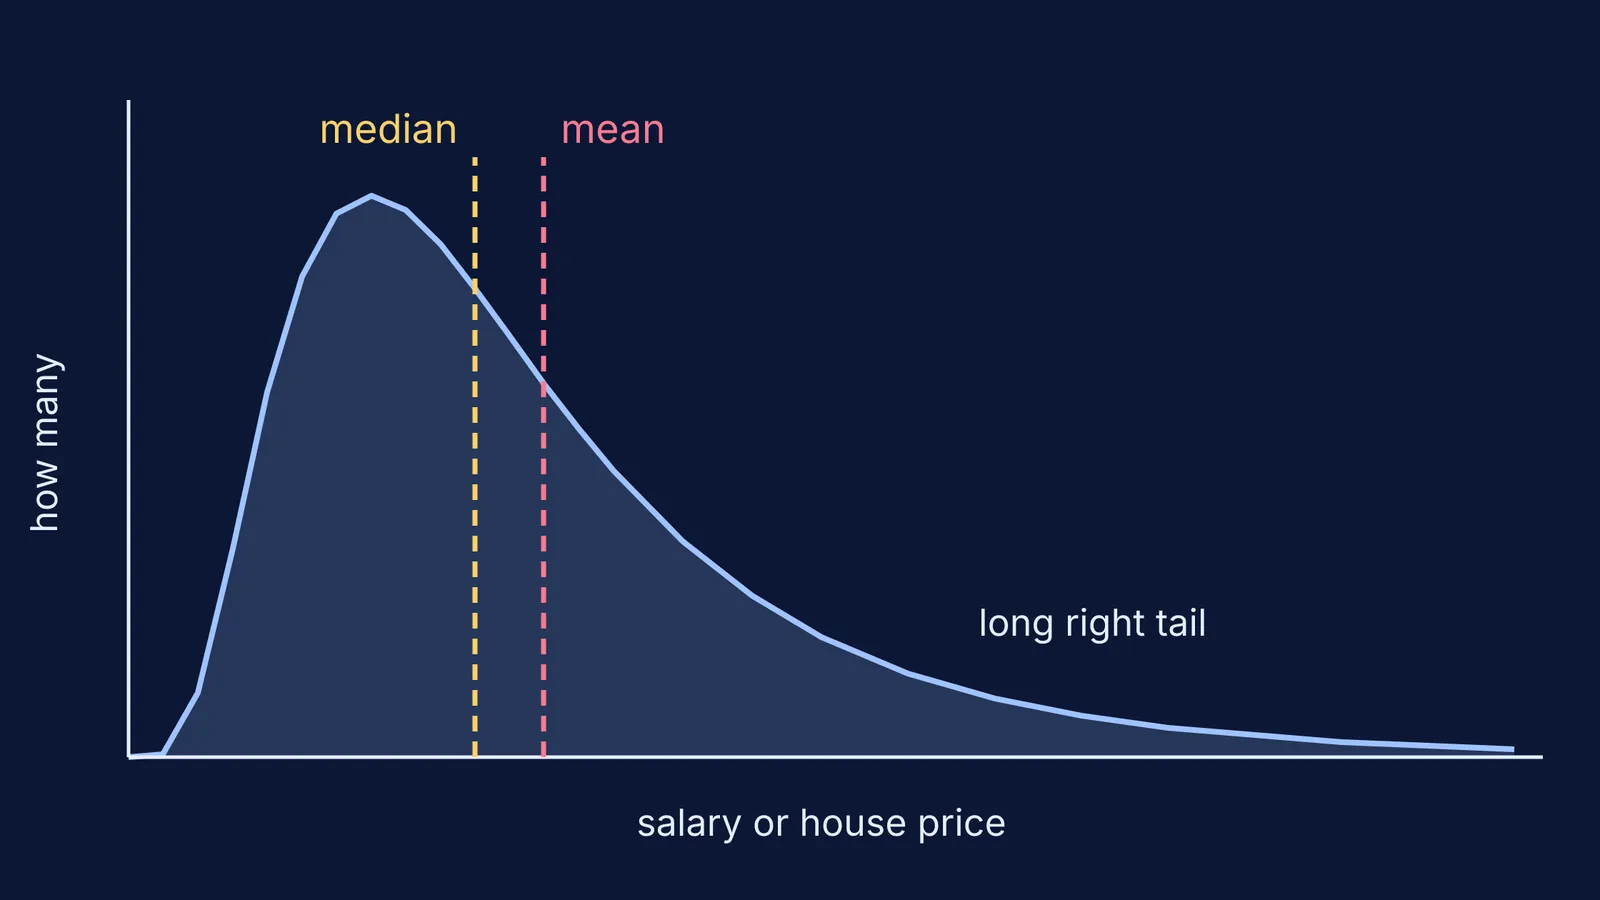
The NIST handbook puts it plainly: for a skewed distribution, the mean is pulled in the direction of the skew. If the right tail is heavier than the left, the mean is greater than the median. The same page notes that extreme values in the tails distort the mean but not the median, so for such data the median gives a better estimate of a typical value.
Salaries and house prices are the classic right-skewed data. Most values sit in a crowded middle, and a few are huge.
The US Census Bureau reported that new houses sold in August 2026 had a median sales price of $393,700 and an average sales price of $478,700. That gap of $85,000 puts the average about 22% above the median, the pattern a right skew produces. Income figures are usually reported as medians too: the Census Bureau's Income in the United States: 2024 gives median household income as $83,730 in 2024.
A worked example: placement salaries
Here is a made-up batch of 9 placed graduates, with salaries in lakh rupees per year:
4, 4.5, 5, 5, 5.5, 6, 6, 7, 45
Mean: the sum is 88, so the mean is 88 / 9 = 9.8 lakh.
Median: the data is already sorted, and the 5th value of 9 is 5.5 lakh.
Check: 8 of the 9 graduates earn less than the mean.
Remove the 45 and recompute: the mean falls to 43 / 8 = 5.4 lakh, while the median becomes (5 + 5.5) / 2 = 5.25 lakh.
One value moved the mean by about 4.4 lakh. It moved the median by 0.25 lakh. That is what "robust to outliers" means in practice.
Indian rankings use this logic. Institutions submitting data for NIRF report the "Median salary of placed graduates", as you can see in VIT's published NIRF 2025 data. If a college only quotes an average or the highest package, read our guide on how to check if college placement claims are real.
When should you use median instead of mean?
Choose the median when:
one or a few values are far from the rest (one 45-lakh package, one mansion)
the data is skewed, with a long tail on one side (incomes, house prices, waiting times)
the last class is open-ended, such as "50 and above", so you cannot work out an exact mean
Choose the mean when:
the data is roughly symmetric with no extreme values, such as heights of students in a class
you need a total, because mean × number of values = total
you need further calculations, since variance and standard deviation are built on deviations from the mean (see why the sum of deviations from the mean is zero)
For skewed data, NIST says the mean, median and mode are all useful, so in a project report, give both and explain the gap.
How do you justify your choice in a statistics answer?
Examiners want the reason, not just the word. Use four steps:
Describe the shape: say the data is skewed, and in which direction.
Name the outlier: quote the actual value.
Show the effect: give the mean and say how many values lie below it.
Conclude: the median depends only on the middle value, so it represents the typical case better.
If you pick the right measure but slip in the arithmetic, especially with grouped data, the Fermi Problem Library has worked problems with a step-by-step solver that explains the reasoning rather than printing an answer. To revise mean, median and mode as ideas first, the Fermi Concept Library gives each mathematics concept its own lesson.
Next time you see an "average" salary or price, ask for the median too.


