

On this page
The median is a measure of central tendency that tells you the exact middle value of a dataset. When you have an odd number of data points, finding the median is straightforward: you arrange the numbers in order and pick the one right in the center. But when your list has an even number of items, there is no single middle position.
What is the median when the number of observations is even?
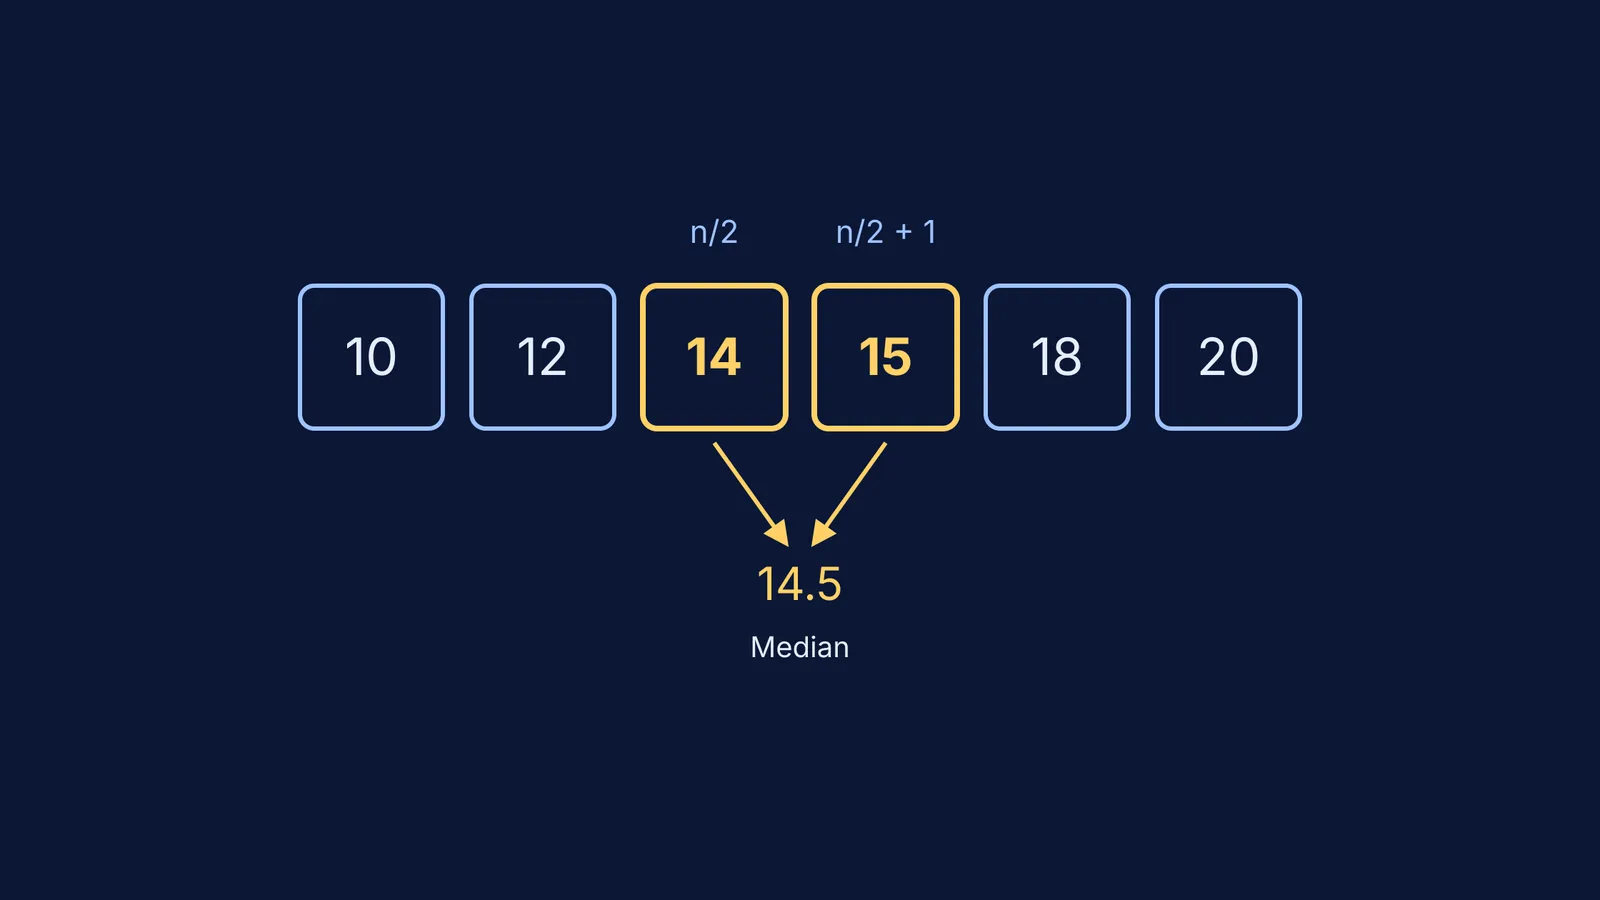
When the total count of numbers (which we will call *n*) is even, the median is the average of the two middle values. As explained in Khan Academy's review of mean and median, the median is the average of the two middle numbers. You locate these central points by finding the *(n/2)*th term and the *(n/2 + 1)*th term, adding them together, and dividing their sum by 2.
Because you are calculating an arithmetic mean of two adjacent terms, the median of a dataset with an even number of observations is frequently a decimal or a number that does not actually appear anywhere in your original list. This is perfectly normal. While the mode must be an existing data point, the median is simply a positional marker that splits your data into a lower half and an upper half.
How do you calculate the median step by step?
To see how the rule applies, let us find the median of this raw dataset: 20, 12, 15, 10, 14, 18.
Sort the data. You must always arrange your numbers in ascending order first. If you skip this step, you will just be finding the middle of a random sequence, which tells you nothing about the data's central tendency.
Our sorted list becomes: 10, 12, 14, 15, 18, 20.
Count the observations. Here, we have *n* = 6 numbers.
Find the two middle positions.
The first middle term is at the *n*/2 position: 6 / 2 = the 3rd term.
The second middle term is at the *(n/2) + 1* position: 3 + 1 = the 4th term.
Identify the values. Looking back at our sorted list (10, 12, 14, 15, 18, 20), the 3rd term is 14 and the 4th term is 15.
Take the average. Add the two values together and divide by two.
Median = (14 + 15) / 2 = 29 / 2 = 14.5.
As expected, 14.5 is the dividing line of the dataset. Exactly half the values (10, 12, 14) are smaller than 14.5, and exactly half the values (15, 18, 20) are larger.
Why use the median instead of the mean?
While the mean (the arithmetic average) is widely used, it has a significant drawback: it is easily skewed by outliers. If you have a dataset of incomes and one person earns ten times more than everyone else, the mean income will be artificially high. The median, on the other hand, is a robust statistic. Because it only cares about the order of the values, an extreme outlier at the very top or bottom does not shift the middle position. This makes the median the preferred measure of central tendency for skewed distributions, such as real estate prices.
In a perfectly symmetrical dataset, the mean, median, and mode will all land on the exact same value. When analyzing real-world data like test scores or demographics, statisticians look at both the mean and the median to understand the shape of the distribution. By grasping how to calculate the median correctly, you build a strong foundation for more advanced data analysis.
How do you find a missing observation if the median is given?
In board exams and competitive tests, you are frequently asked to find an unknown variable, often labeled *x*, when a sorted dataset and its median are already provided. This tests your understanding of the positional formula.
Example problem: The following six observations are already arranged in ascending order: 12, 14, *x*, *x* + 2, 22, 25. If the median of this data is 18, find the value of *x*.
First, confirm the total number of observations. We have *n* = 6, which is even. The formula tells us that the median will be the average of the 3rd and 4th terms.
Looking at the list, the 3rd term is *x* and the 4th term is *x* + 2.
We can set up the equation using the given median of 18: Median = (3rd term + 4th term) / 2 18 = (*x* + (*x* + 2)) / 2
Now, solve for *x*: Multiply both sides by 2 to clear the fraction: 36 = 2*x* + 2 Subtract 2 from both sides: 34 = 2*x* Divide by 2: *x* = 17
You can double-check the work by plugging 17 back into the list. The sequence becomes 12, 14, 17, 19, 22, 25. The middle terms are 17 and 19, and their average is indeed 18.
If you are working through statistics questions like this one, the Fermi Problem Library has worked problems with a step-by-step solver that explains the reasoning rather than printing an answer.
What happens when the data changes?
Sometimes a problem asks what happens to the median if you alter the dataset. Because the median relies entirely on the rank order of values, adding a fixed constant to every observation shifts the median by that exact same constant. You can read more about how adding to or scaling data changes the mean and variance.
Once you are comfortable locating the central value, you will use it as the foundation for measuring dispersion. For instance, in Class 11 statistics, you will need to find the median first before you can calculate the mean absolute deviation about the median. By mastering the even-number rule now, those longer multi-step calculations will be much easier to handle.


