

On this page
When you first study statistics, one of the earliest properties you learn is that the algebraic sum of deviations from the arithmetic mean is always zero 1.
It sounds like a mathematical trick, but it is actually the defining physical feature of the mean itself. The mean acts as the precise balance point of your data, exactly like placing the fulcrum on a children's seesaw. The sum of the distances of all points sitting above the mean perfectly cancels out the sum of the distances of all points sitting below the mean. If you shift a data point higher, the mean will shift higher just enough to restore that perfect zero balance.
How do you prove the sum of deviations is zero?
We can prove this property mathematically with a single line of algebra. Let x₁, x₂, …, xₙ be a set of n observations in a dataset, and let their arithmetic mean be μ.
By definition, the mean is simply the sum of all observations divided by the total number of observations, n: μ = (Σxᵢ) / n Rearranging this formula to solve for the sum gives us: Σxᵢ = nμ
The total sum of deviations from the mean is written as Σ(xᵢ − μ). When we expand this summation across all our data points, we get: Σ(xᵢ − μ) = Σxᵢ − Σμ
Since our mean μ is a constant value, adding it up n times is exactly the same as multiplying it by n. Therefore, Σμ becomes nμ. Substituting our earlier rearrangements into the expanded equation: Σ(xᵢ − μ) = nμ − nμ = 0
Can you show a quick worked example?
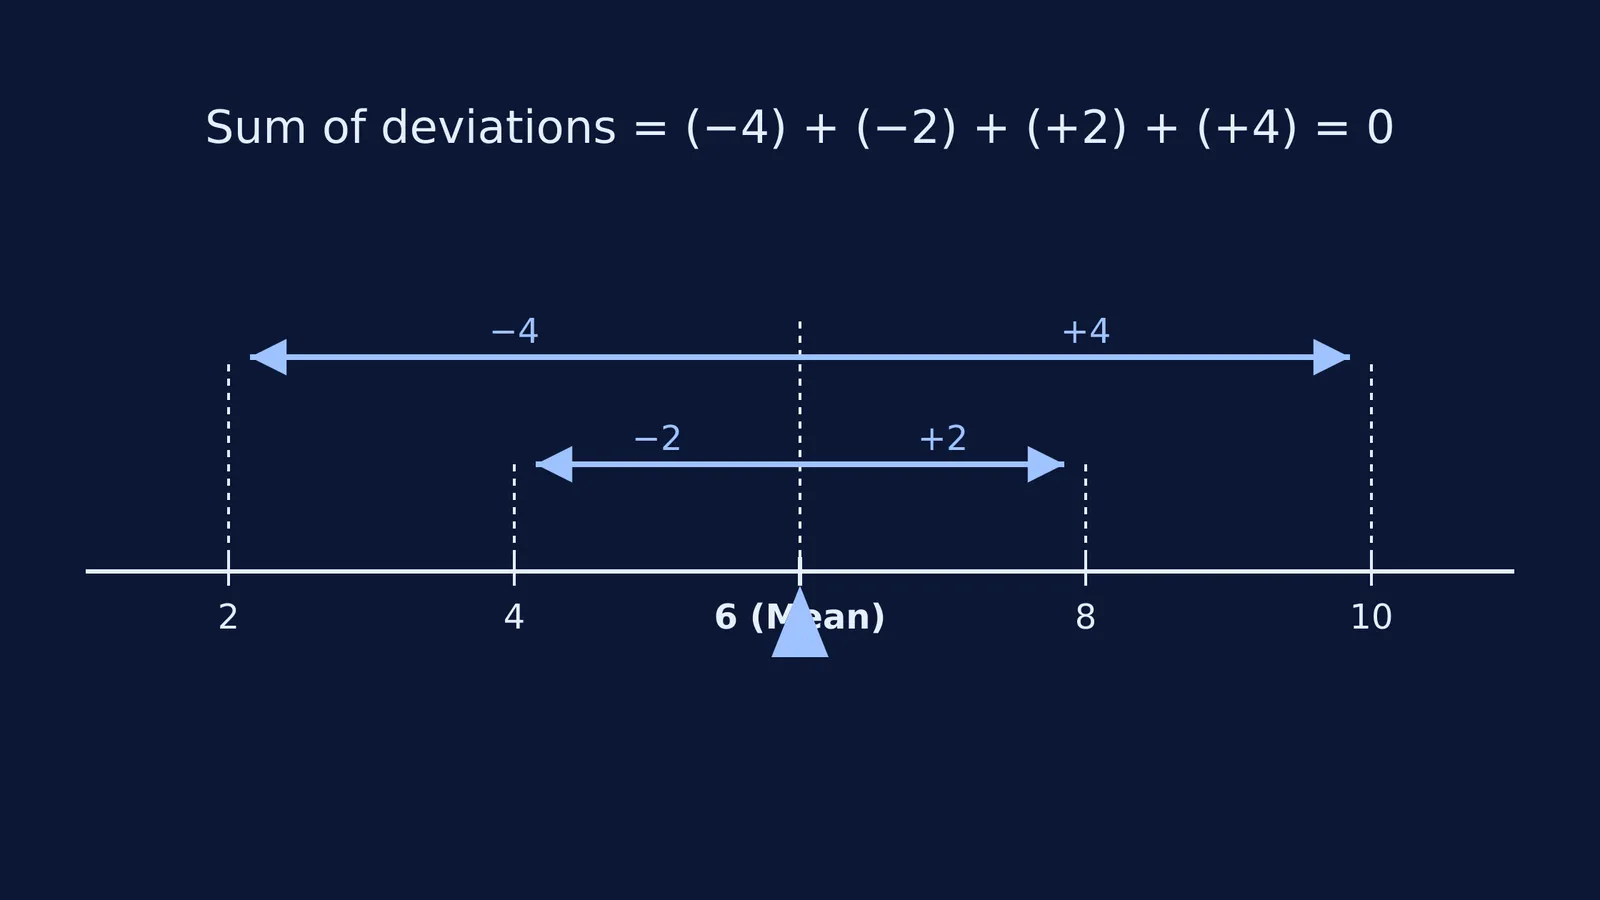
To see this zero-sum balancing act in action, let us take a small, practical set of numbers: 2, 4, 8 and 10.
First, find the mean: (2 + 4 + 8 + 10) / 4 = 24 / 4 = 6.
Next, calculate the deviation for each individual number (x − 6):
2 − 6 = −4
4 − 6 = −2
8 − 6 = +2
10 − 6 = +4
Finally, add these deviations together: (−4) + (−2) + (+2) + (+4) = 0.
If you find yourself stuck on algebraic proofs or standard statistical properties while preparing for an exam, the Fermi Concept Library has its own lesson for every concept in mathematics, helping you understand the ideas and their place in the map.
Why does this make it useless as a spread measure?
The primary goal of measuring dispersion (or spread) in statistics is to find out how widely scattered your data points are around the centre. But if we try to use the simple sum of deviations to measure this spread, we face an immediate problem: we will always get zero, no matter how tightly clustered or widely scattered the numbers happen to be.
For instance, consider a highly consistent data set like 5, 6, 7. This has a mean of 6 and a sum of deviations of 0. Now consider an extremely erratic data set like −100, 6, 112. This also has a mean of 6 and a sum of deviations of exactly 0. The raw sum tells us absolutely nothing about how far apart the numbers lie, because the vast extremes in the second data set simply cancel each other out.
Fixing the zero sum with absolute values and squares
Because the positive and negative signs relentlessly cancel each other out, we need a mathematical way to ensure all deviations become positive before we average them together. The field of statistics solves this problem using two primary methods:
Mean Deviation: The most intuitive approach is to take the absolute value of each distance (|xᵢ − μ|). This completely ignores the negative signs, turning the −4 and −2 in our earlier example into +4 and +2. The sum of these absolute deviations is no longer zero (4 + 2 + 2 + 4 = 12), and dividing by n (which is 4) gives us a mean absolute deviation of 3.
Variance and Standard Deviation: The more mathematically robust approach is to square each distance ((xᵢ − μ)²). Squaring any negative number automatically makes it positive, so our −4 becomes 16, and −2 becomes 4. The average of these squared deviations is called the variance. Squaring not only eliminates negative signs but heavily penalises extreme outliers, making it incredibly useful for advanced analysis. Taking the square root of the variance returns the scale to its original units, giving us the standard deviation, which remains the most common measure of spread in all of statistics.
If you are working through statistics problems, you will also need to know how adding to or scaling data changes the mean and variance. For larger data sets, you might frequently use the combined SD formula or be asked to calculate the mean absolute deviation about the median instead of the mean.


