
On this page
Biodiversity and its Conservation is Chapter 13 of the CBSE Class 12 Biology curriculum for 2026-27, in Unit X, Ecology and Environment. The CBSE 2026-27 Biology sample paper has 2 case-based questions of 4 marks each in Section D. Below are three original cases, easy to hard. Facts are checked against the NCERT Biodiversity and Conservation chapter (Reprint 2026-27); the scenarios and numbers are invented for practice. For full chapter notes, read our Biodiversity and Conservation Class 12 board exam guide.
Case 1: A seed festival in the Western Ghats
A farmers' collective in a Western Ghats village in Karnataka holds a seed festival. Its stalls show 46 traditional strains of rice, all one species, that differ in grain colour, aroma and flood tolerance. Only 9 strains are still grown widely; seeds of the rest are dried and stored in the collective's seed bank. Behind the fields is a forest patch where, by custom, no tree is cut and no animal hunted. A volunteer points out that Lantana is spreading along the forest edge.
(i) The 46 rice strains show: (a) species diversity (b) genetic diversity (c) ecological diversity (d) endemism.
(ii) Is the seed bank an in situ or an ex situ method?
(iii) What is the protected patch of forest called? Name one other region of India where such patches are found.
(iv) Which cause of biodiversity loss does the Lantana show, and how does it harm the patch?
Answers.
(i) (b). Variation within one species over its range is genetic diversity; NCERT notes India has more than 50,000 genetically different strains of rice.
(ii) Ex situ: seeds of different genetic strains are stored for long periods away from their habitat.
(iii) A sacred grove, an in situ method. Others: Khasi and Jaintia Hills (Meghalaya), Aravalli Hills (Rajasthan), or Sarguja, Chanda and Bastar (Madhya Pradesh).
(iv) Alien species invasion. Lantana is an invasive weed that can cause the decline or extinction of indigenous species.
Case 2: Grass plots on a college campus
A Bengaluru college ecology club sets up two outdoor plots of equal size. Plot A is sown with one grass species; plot B with eight local species. Each year they harvest and weigh the dry biomass. Plot A gives 320, 180, 410 and 210 g per square metre over four years; plot B gives 520, 480, 560 and 500. Year 2 had a dry monsoon.
(i) Whose long-term outdoor plot experiments does this design follow? (a) Alexander von Humboldt (b) Robert May (c) David Tilman (d) Paul Ehrlich.
(ii) Find the mean biomass and the range (highest minus lowest) for each plot.
(iii) By what percentage did each plot's biomass fall from year 1 to the dry year 2? Which loss-of-biodiversity effect does plot A show?
(iv) Which plot is more stable by NCERT's definition? If one species had to be removed from plot B, why might it matter which one?
Answers.
(i) (c). Tilman found that plots with more species showed less year-to-year variation in total biomass, and that diversity raised productivity.
(ii) Plot A: mean = 1,120 / 4 = 280 g per square metre; range = 410 - 180 = 230. Plot B: mean = 2,060 / 4 = 515; range = 560 - 480 = 80.
(iii) Plot A: (320 - 180) / 320 × 100 = 43.75 per cent. Plot B: (520 - 480) / 520 × 100 ≈ 7.7 per cent. Plot A shows lowered resistance to perturbations such as drought.
(iv) Plot B: a stable community does not vary much in productivity from year to year. By the rivet popper analogy, losing a key species that drives a major function, like a rivet on the wing, hurts more than losing a minor one.
Case 3: How do you use the species-area relationship?
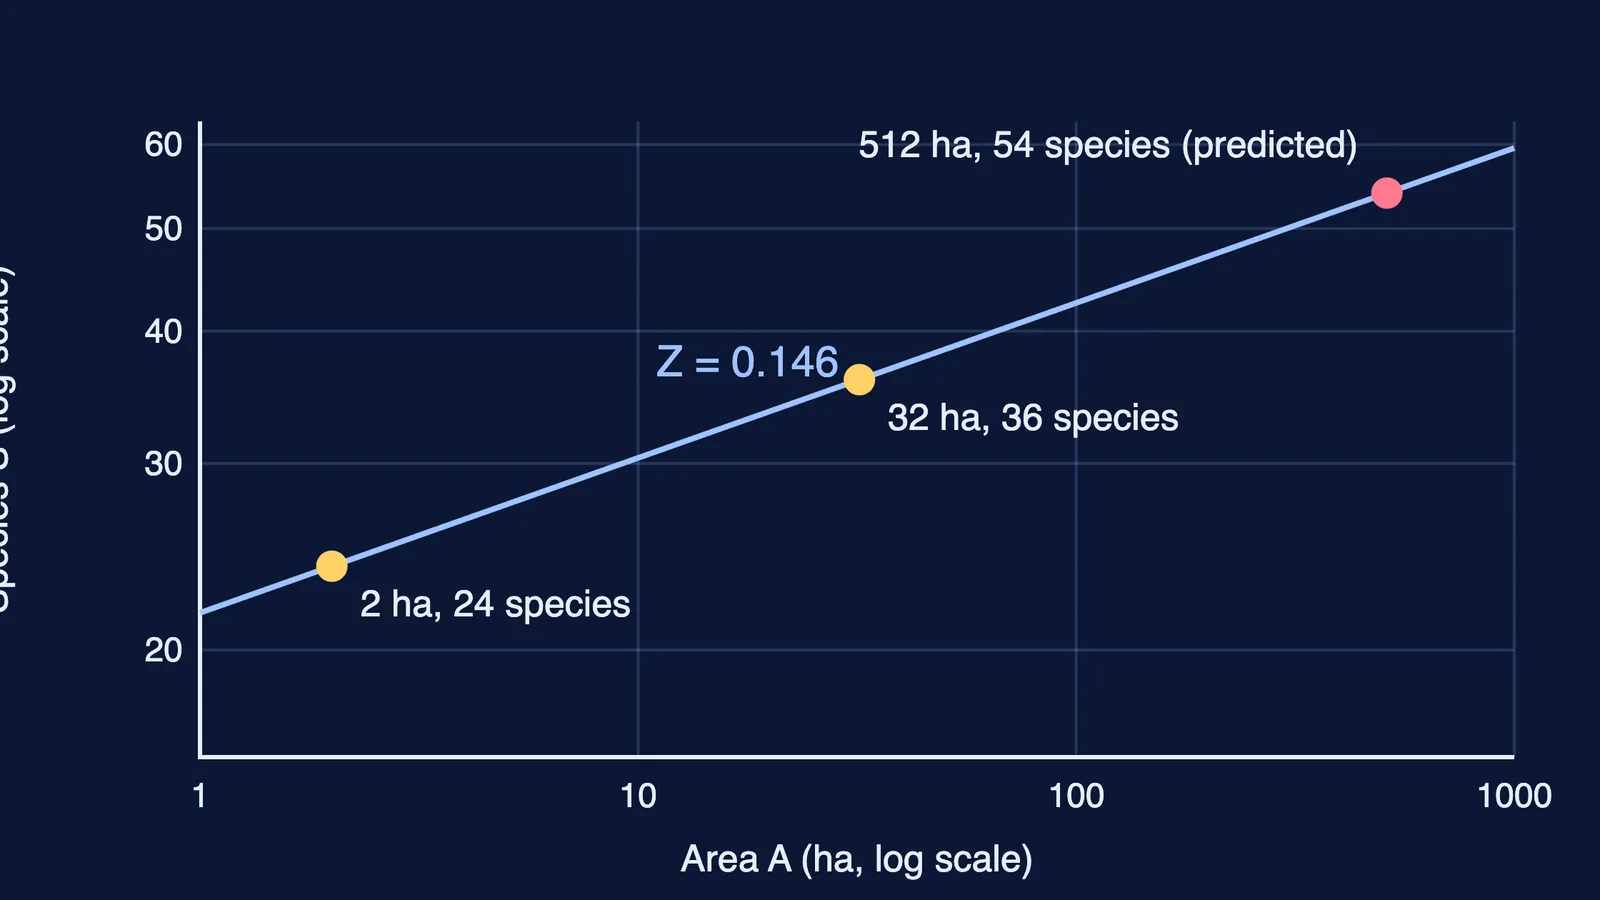
Students survey butterflies in a sanctuary using nested plots. A 2-hectare plot holds 24 species; the 32-hectare plot around it holds 36. Their teacher says the region follows log S = log C + Z log A. A developer proposes clearing everything except the 2-hectare core.
(i) On ordinary (not log) axes, the species-area curve is: (a) a straight line (b) a rectangular hyperbola (c) a bell curve (d) a J-shaped curve.
(ii) Find Z from the two plots. Is it typical for one region?
(iii) Predict the species in a 512-hectare block of the same sanctuary.
(iv) If only the 2-hectare core remains, how many species would the model predict, and what share is lost? Which cause of loss is this, and which animals suffer most?
Answers.
(i) (b). On a log scale it becomes a straight line.
(ii) Z = (log 36 - log 24) / (log 32 - log 2) = log 1.5 / log 16 = 0.176 / 1.204 ≈ 0.146. Yes: NCERT gives Z values of 0.1 to 0.2 regardless of taxonomic group or region; only very large areas such as entire continents give much steeper slopes, 0.6 to 1.2.
(iii) S = 24 × (512 / 2)^Z = 24 × 256^Z. Since 256 = 16² and 16^Z = 1.5, 256^Z = 1.5² = 2.25, so S = 24 × 2.25 = 54 species.
(iv) 24 species, so (36 - 24) / 36 = one-third are lost. This is habitat loss and fragmentation, the most important cause of extinction; animals needing large territories and migratory animals are hit hardest.
How do you solve biodiversity case study questions?
Sort every clue into a level. Strains of one crop: genetic. Many species in one place: species. Many habitat types: ecological.
Label each method in situ or ex situ.
Match each threat to the evil quartet: habitat loss and fragmentation, over-exploitation, alien species invasions, co-extinctions.
Take logs before you divide. In species-area sums, Z is a ratio of log differences; write the formula, then the numbers.
Quote NCERT's wording for stability: not too much variation in productivity from year to year, resistance or resilience to occasional disturbances, and resistance to invasions by alien species.
For a method across chapters, see how to answer case-based questions in board exams, then test yourself on the biodiversity and conservation assertion-reason questions. If the log steps in Case 3 trip you up, the Fermi Problem Library has worked problems with a step-by-step solver that explains the reasoning rather than printing an answer.