
On this page
Statistics is Chapter 13 of the NCERT Class 11 Mathematics textbook (2026-27 reprint). The CBSE Mathematics syllabus for 2026-27 lists it as measures of dispersion: range, mean deviation, variance and standard deviation of ungrouped and grouped data. Below are 30 key terms in four groups. For the full chapter plan, see our Statistics Class 11 Maths guide.
Not covered: the coefficient of variation and comparing two frequency distributions, which are in neither the current NCERT chapter nor the CBSE 2026-27 syllabus.
Why is the mean not enough?
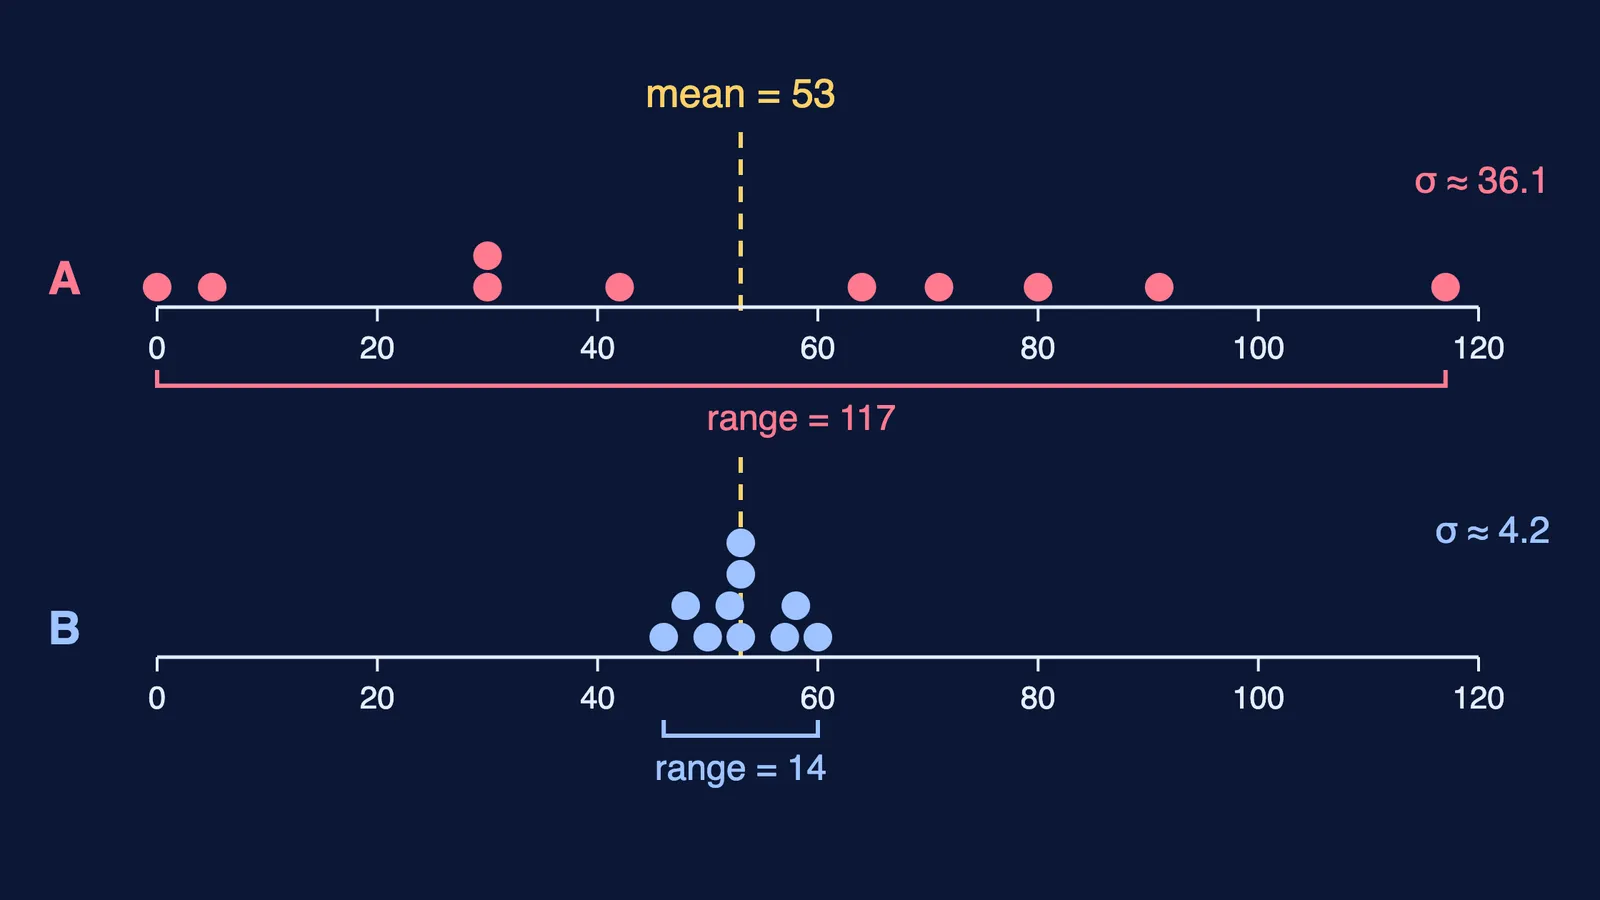
NCERT opens with two batsmen, A and B, whose ten scores have the same mean but very different spread (NCERT, section 13.1).
Observation (xᵢ): one value in the data, written x₁, x₂, ..., xₙ.
Measure of central tendency: one value showing roughly where the data are centred: mean, median or mode.
Mean (x̄): the sum of the observations divided by their number. Example: both batsmen average 530 ÷ 10 = 53.
Median (M): the middle value of the ordered data; for even n, the mean of the two middle values. Example: both batsmen have M = 53.
Dispersion (scatter, variability): how spread out the observations are around a central value.
Measure of dispersion: one number that summarises how spread out the data are. NCERT names range, quartile deviation (not studied in the chapter), mean deviation and standard deviation.
Range: maximum value minus minimum value. Example: A has 117 − 0 = 117, B has 60 − 46 = 14. Don't confuse with: mean deviation or σ; range uses only the two extreme values, not deviations from a centre.
What is mean deviation?
Examples: NCERT's Examples 1 and 3 (section 13.4).
Deviation: the difference x − a between an observation and a fixed value a. It can be negative.
Sum of deviations from the mean: always 0; their average cannot measure spread. Example: for 6, 7, 10, 12, 13, 4, 8, 12 (x̄ = 9), the deviations −3, −2, 1, 3, 4, −5, −1, 3 add to 0.
Absolute deviation |xᵢ − a|: the deviation with its minus sign dropped, its distance from a on the number line.
Mean deviation about a, M.D.(a): the mean of the absolute deviations, (1/n) Σ|xᵢ − a|.
Mean deviation about the mean, M.D.(x̄): (1/n) Σ|xᵢ − x̄|. Example: for the data above, 22 ÷ 8 = 2.75.
Mean deviation about the median, M.D.(M): (1/n) Σ|xᵢ − M|. Example: for 3, 9, 5, 3, 12, 10, 18, 4, 7, 19, 21, M = 9 and M.D.(M) = 58 ÷ 11 ≈ 5.27. Don't confuse with: M.D.(x̄).
Limitation of mean deviation: absolute values resist further algebra, so the chapter moves on to standard deviation.
Grouped data: which terms do you need?
Examples: NCERT's Example 7 and Table 13.5 (section 13.4.2).
Frequency (fᵢ): how often a value, or a value in a class, occurs.
N = Σfᵢ: the total of all frequencies, which replaces n in grouped formulas.
Discrete frequency distribution: distinct values x₁, ..., xₙ listed with their frequencies f₁, ..., fₙ.
Continuous frequency distribution: data sorted into class intervals without gaps, such as 0-10, 10-20, with a frequency for each.
Class width (h): the size of each class interval. Example: 10 for 10-20. Inclusive classes (16-20, 21-25) are first widened by 0.5 at each end.
Mid-point (xᵢ of a class): (lower limit + upper limit) ÷ 2; the class's whole frequency is treated as sitting there. Example: 15 for 10-20.
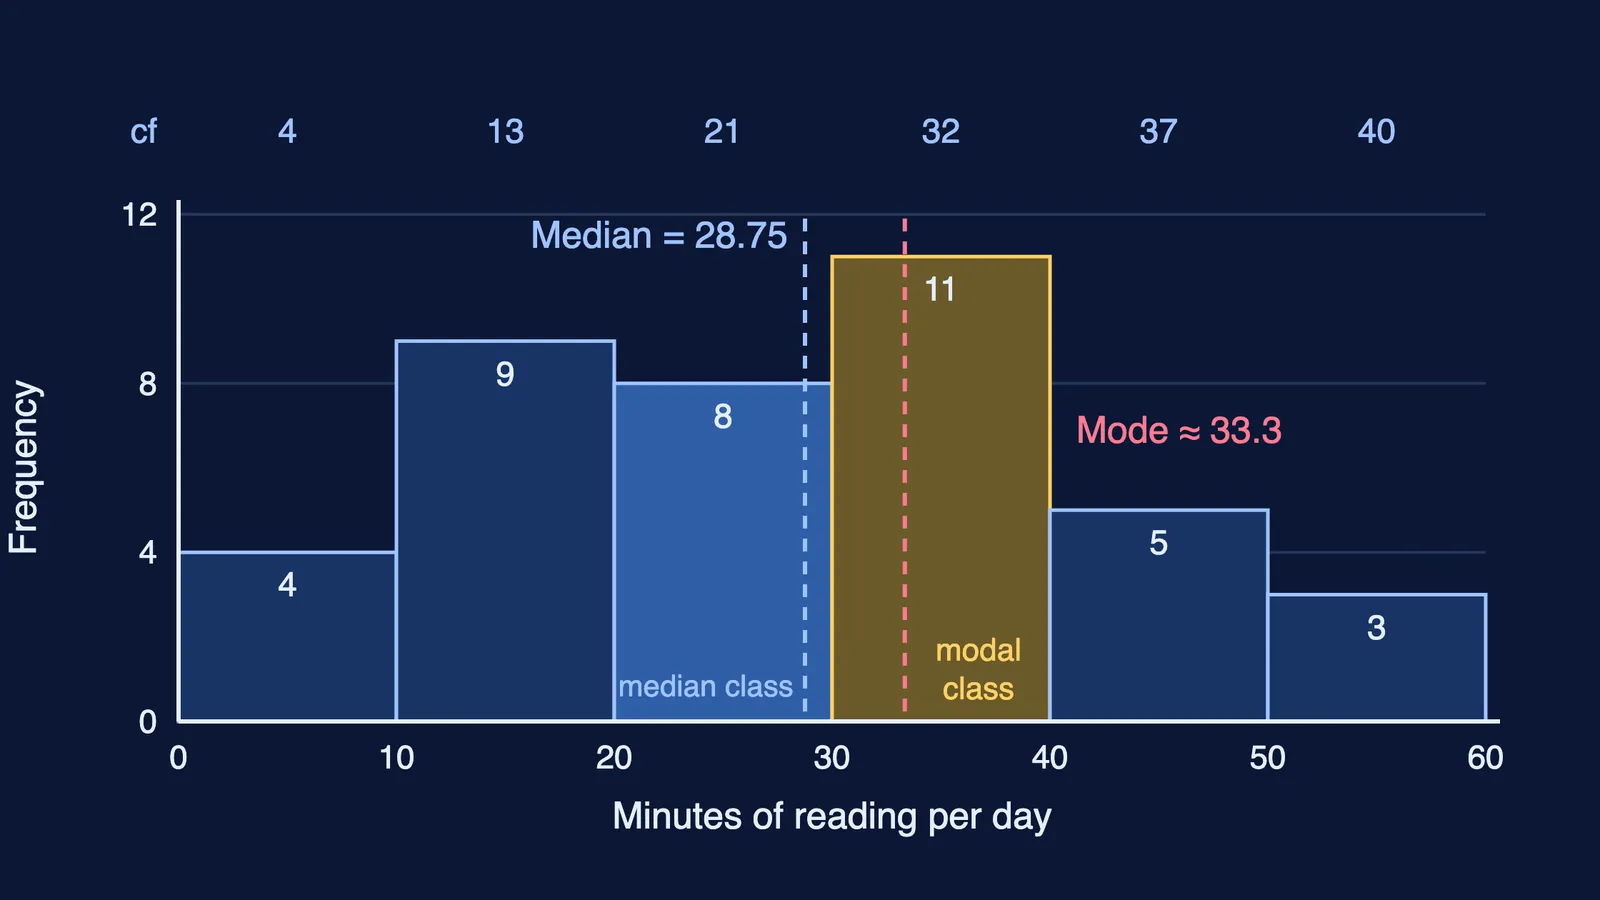
Cumulative frequency (c.f.): the running total of frequencies up to a value or class. Example: frequencies 3, 4, 5 give c.f. 3, 7, 12.
Median class: the class whose cumulative frequency first equals or exceeds N/2. Median = l + ((N/2 − C) ÷ f) × h, with l, f, h that class's lower limit, frequency and width, and C the previous c.f. Example: l = 20, C = 13, f = 15, h = 10, N = 50 give 20 + 8 = 28.
Assumed mean (a or A): a convenient value near the middle of the data; subtracting it shifts the origin.
Step-deviation (dᵢ or yᵢ): (xᵢ − A) ÷ h; dividing by the common factor h changes the scale. Example: with A = 45, h = 10, the mid-point 65 becomes 2. Don't confuse with: the deviation xᵢ − x̄ used in mean deviation.
What is the difference between variance and standard deviation?
NCERT divides by n (or N), not n − 1 (section 13.5).
Squared deviation (xᵢ − x̄)²: squaring removes minus signs. Their plain sum misleads: 5, 15, ..., 55 gives 1750 and 15, 16, ..., 45 gives 2480, though the first set is more spread.
Variance (σ²): the mean of the squared deviations from the mean, (1/n) Σ(xᵢ − x̄)², or (1/N) Σfᵢ(xᵢ − x̄)² for grouped data. Example: the two sets above give 291.67 and 80.
Standard deviation (σ): the positive square root of the variance, in the same unit as the data. Example: 6, 8, ..., 24 has x̄ = 15, σ² = 33 and σ ≈ 5.74. Don't confuse with: variance, whose unit is squared (runs², not runs).
Alternative formula for σ: σ = (1/N)√(NΣfᵢxᵢ² − (Σfᵢxᵢ)²), which skips subtracting x̄ from each value.
Shortcut (step-deviation) method: with yᵢ = (xᵢ − A) ÷ h, the mean is x̄ = A + h·ȳ and σₓ = h·σᵧ.
Effect of changing the data: adding the same number to every observation leaves the variance unchanged; multiplying every observation by k multiplies the variance by k². Example: variance 5, each value doubled, new variance 20.
How to learn these terms
Learn the chapter as one chain: deviation, absolute deviation, mean deviation, squared deviation, variance, standard deviation.
Keep the pairs apart: M.D.(x̄) and M.D.(M), variance and standard deviation, n and N.
Sketch a dot plot first; it shows which set should have the larger σ.
Practise with our mean, variance and standard deviation worked problems, and revise mean and median from the measures of central tendency guide for Class 11 statistics.
If the median of grouped data still feels shaky, the Fermi Concept Library gives every mathematics concept its own lesson and shows where it sits in the map.