
On this page
Statistics is Chapter 13 of the NCERT Class 10 Mathematics textbook (2026-27 reprint). The CBSE Class 10 Mathematics syllabus for 2026-27 lists one topic: mean, median and mode of grouped data, with bimodal situations avoided. Below are 33 key terms in five groups; for the chapter plan, read our Statistics Class 10 guide.
Not covered: ogives (cumulative frequency curves), which the chapter's introduction and closing note name but no section teaches and the syllabus does not list, and the median for unequal class sizes.
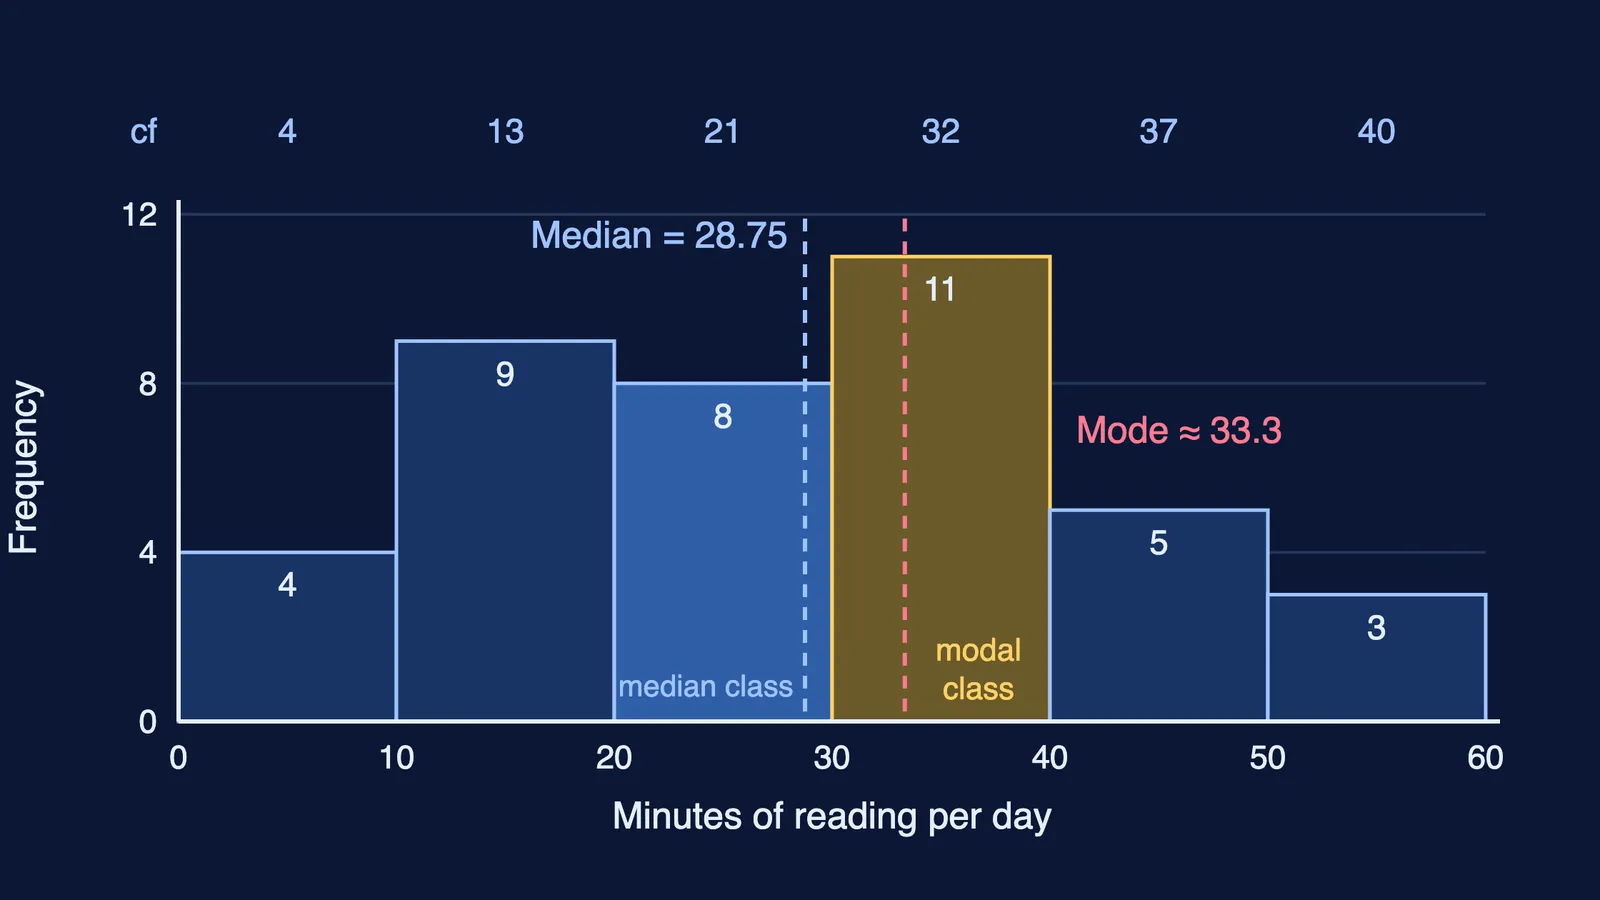
Every example uses one table: daily reading time of 40 students, in classes 0-10, 10-20, 20-30, 30-40, 40-50 and 50-60 minutes, with frequencies 4, 9, 8, 11, 5 and 3.
What is grouped data in Class 10 statistics?
Observation: one recorded value, such as one student's 27 minutes.
Frequency (f): how many observations fall on a value or inside a class. Example: 11 students read 30-40 minutes.
Ungrouped data: the raw list of observations.
Grouped frequency distribution: a table that sorts observations into class intervals and gives the frequency of each.
Class interval: one group in the table, like 20-30.
Lower and upper class limits: the two ends of a class, 20 and 30 for 20-30. By NCERT's convention, a value equal to an upper limit goes into the next class: 30 minutes counts in 30-40.
Class size (h): the width of a class, upper limit minus lower limit. Example: 30 − 20 = 10.
Class mark (xᵢ): the mid-point of a class, (upper limit + lower limit) ÷ 2. Example: 25 for 20-30. Don't confuse with: class size, which is the width, not the middle.
Continuous class intervals: classes with no gaps, each upper limit being the next lower limit. NCERT's note says the median and mode formulas need them.
Measure of central tendency: one number that represents the centre of the data. The three in this chapter are mean, median and mode.
How do you find the mean of grouped data?
Mean (x̄): the sum of all observations divided by their number; for grouped data, x̄ = Σfᵢxᵢ ÷ Σfᵢ.
Σ (sigma): the Greek capital letter meaning "add these up".
Mid-point assumption: treating every observation in a class as sitting at its class mark, so the grouped mean is an approximation.
Direct method: add fᵢxᵢ over all classes and divide by Σfᵢ. Example: Σfᵢxᵢ = 1130 and Σfᵢ = 40, so x̄ = 28.25 minutes.
Assumed mean (a): one class mark, usually near the centre, chosen to shrink the numbers. Example: a = 35.
Deviation (dᵢ): dᵢ = xᵢ − a. Example: for the class mark 5, d = 5 − 35 = −30.
Assumed mean method: x̄ = a + Σfᵢdᵢ ÷ Σfᵢ. Example: Σfᵢdᵢ = −270, so x̄ = 35 − 6.75 = 28.25.
Step deviation (uᵢ): uᵢ = (xᵢ − a) ÷ h, where h is the class size (or a common factor of every dᵢ).
Step-deviation method: x̄ = a + h × (Σfᵢuᵢ ÷ Σfᵢ). Example: Σfᵢuᵢ = −27, so x̄ = 35 + 10 × (−27 ÷ 40) = 28.25. All three methods give the same mean.
What is the modal class?
Mode: the observation with the highest frequency in ungrouped data.
Modal class: the class with the highest frequency. Example: 30-40, with 11 students.
Mode of grouped data: Mode = l + [(f₁ − f₀) ÷ (2f₁ − f₀ − f₂)] × h, where l is the modal class's lower limit, f₁ its frequency, f₀ the preceding class's frequency and f₂ the next class's. Example: 30 + (3 ÷ 9) × 10 ≈ 33.3. Don't confuse with: the modal class, which is an interval; the mode is one value inside it.
Multimodal data: two or more values share the highest frequency. The chapter sticks to data with a single mode.
What is cumulative frequency and the median class?
Median: the middle value of data arranged in order. For n ungrouped observations it is the ((n + 1) ÷ 2)th value if n is odd, and the mean of the (n ÷ 2)th and (n ÷ 2 + 1)th values if n is even.
Cumulative frequency (cf): a running total of frequencies up to and including a class. Example: 4, 13, 21, 32, 37, 40.
Cumulative frequency table: values listed with their cumulative frequencies.
Less than type: counts below each upper limit. Example: 21 students read less than 30 minutes.
More than type: counts at or above each lower limit. Example: 19 students read 30 minutes or more. Don't confuse with: less than type, which uses upper limits.
Median class: the first class whose cumulative frequency exceeds n ÷ 2. Example: n ÷ 2 = 20, so 20-30 (cf 21).
Median of grouped data: Median = l + [(n ÷ 2 − cf) ÷ f] × h, where l, f and h belong to the median class and cf is the cumulative frequency of the class before it. Example: 20 + (7 ÷ 8) × 10 = 28.75. Don't confuse with: the median class's own cf (21); the formula uses 13.
Which measure should you use?
Extreme values: unusually large or small observations; they pull the mean away.
Choosing a measure: the mean uses every observation; the median suits a typical value when extremes exist, such as wages; the mode picks the most popular item.
Empirical relationship: 3 Median = Mode + 2 Mean, an approximate link between the three. Example: mean 28 and median 29 give a mode near 3 × 29 − 2 × 28 = 31.
If a term still feels slippery, the Fermi Concept Library gives each mathematics concept its own lesson.
How to learn these terms
Build one small table and compute the mean three ways; matching answers show you know a, dᵢ and uᵢ.
Learn the pairs together: class mark and class size, mode and modal class, median class cf and preceding cf.
Write the symbol list (l, h, f, f₀, f₁, f₂, cf) beside each formula before you substitute numbers.
Check classes are continuous before using the median or mode formula.
Practise finding a missing frequency from a given mean or median with our missing frequency guide, then try Probability Class 10.