
On this page
Chapter 6, Dynamics of Population, sits in Theme E of NCERT's Exploring Society: India and Beyond, Part 2, the Grade 8 Social Science book with code hees2, First Edition June 2026. CBSE publishes no separate 2026-27 curriculum for Classes 6 to 8; these classes follow the NCERT book, and this chapter is assessed by the school.
What is demography in Class 8 Social Science?
In the NCERT chapter, demography is the study of a population's size, structure and composition, and how these change through births, deaths and migration. Governments use it to plan schools, hospitals and housing.
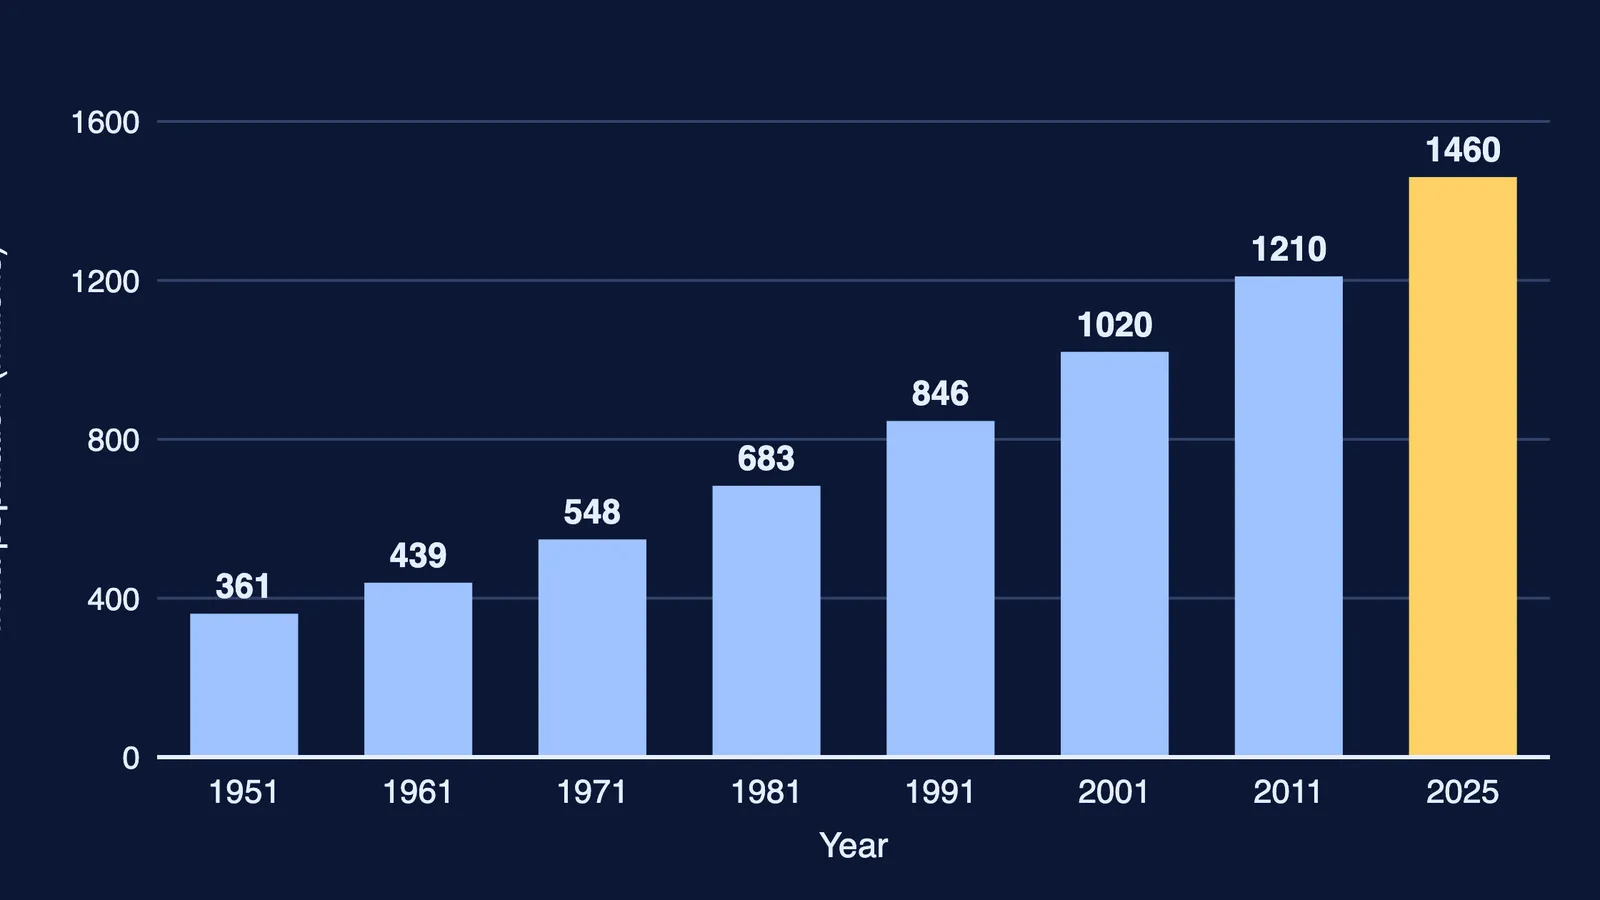
The chapter opens with the big picture. India passed China in 2023 to become the most populous country and holds around 17 per cent of the world's people (NCERT Ch 6). The world's population, 2.5 billion in 1950, had reached 8.2 billion by 2025.
What decides how fast a population grows?
The book names four indicators (NCERT Ch 6):
Birth rate: live births per 1,000 people in a year.
Death (mortality) rate: deaths per 1,000 people in a year.
Fertility rate: how many children, on average, a woman is expected to have over her life. The book calls 2.1 the replacement level: above it numbers tend to rise, below it they may fall.
Migration: people moving from one place to another, within or outside the country.
India's fertility rate was 5.7 in 1950 and is 1.9 in 2025. Child mortality, 271 per 1,000 births in 1950, was down to 28 by 2023, and life expectancy at birth went from 30 years at independence to 70 years in 2024 (NCERT Ch 6).
Worked example: how does a town's population change in a year?
Sonpur, a fictional town, has 20,000 people on 1 January. In the year it records 360 births and 140 deaths; 500 people move in and 220 move out.
Birth rate = 360 ÷ 20,000 × 1,000 = 18 per 1,000.
Death rate = 140 ÷ 20,000 × 1,000 = 7 per 1,000.
Natural increase = 360 − 140 = 220 people (11 per 1,000).
Net migration = 500 − 220 = +280 people.
Population on 31 December = 20,000 + 220 + 280 = 20,500, a growth of 2.5 per cent.
Migration supplied 280 of the 500 extra people, or 56 per cent. The book makes the same point about Delhi, Mumbai and Bengaluru. If Sonpur has 9,880 females and 10,120 males, its sex ratio is 9,880 ÷ 10,120 × 1,000 ≈ 976 females per 1,000 males.
What are the three stages of demographic transition?
The NCERT chapter describes three stages:
Stage 1: high birth and high death rates, so growth is slow. India was here from 1901 to 1921.
Stage 2: death rates fall with better healthcare while birth rates stay high, so growth is rapid. India grew fast after 1951.
Stage 3: death rates stay low and birth rates fall with urbanisation, income, education and more women at work. India's fertility began falling after the mid-1980s and is now below replacement level.
A population pyramid shows the same story by age and gender: a wide base means a young population, a wide top an ageing one. India's has moved from a narrow triangle in the 1950s to a bell shape. Sex ratio counts females for every 1,000 males: 933 in Census 2001 and 943 in 2011 (NCERT Ch 6).
What is India's demographic dividend, and why is the window limited?
The demographic dividend is the growth potential that comes from having a large, young working-age population (NCERT Ch 6). Around 27 per cent of Indians are under 15 and nearly 65 per cent are aged 15 to 59. India's median age is 28, against 50 for Japan. The window is limited: under-fives peaked in 2007, under-15s in 2011, and after 2050 India begins moving towards an older population.
For developing countries the book stresses education, skilling, healthcare and childcare, so that women carrying the "double burden" of job and home can stay in work.
How does this chapter connect, and what should you practise?
The strain migration puts on cities continues in Chapter 7, India's Urban Landscape. For the older book's version, see our Class 8 human resources guide; Class 9 picks the topic up in population size, distribution and growth.
Practice questions (marks are our suggestion):
Define fertility rate and explain what a value below 2.1 suggests. (2 marks)
A village of 5,000 people records 90 births and 40 deaths in a year. Find its birth rate and death rate per 1,000. (2 marks)
Explain, with India as the example, how Stage 2 differs from Stage 3 of demographic transition. (3 marks)
The number of Indians under 15 peaked in 2011. Explain what this means for the share of young workers after 2050, and name one pressure an older population puts on a country. (5 marks)
Q2 answer: 18 and 8 per 1,000.
Stuck on which part to revise first? Fermi's AI tutor works out what you already know and builds a plan for the session.