
On this page
"Tales by Dots and Lines" is Chapter 5 of NCERT's Ganita Prakash, Part II, the Grade 8 maths textbook (code hegp2, First Edition December 2025). Its preface says the chapter gives a new view of the mean and introduces line graphs (Ganita Prakash Part II prelims, NCERT). CBSE's 2026-27 curriculum page lists syllabi only from Class IX up, so Classes 6-8 follow the NCERT book and this chapter is assessed by the school (CBSE curriculum 2026-27). Every number below is ours, checked twice.
Why is the mean the balance point of a dot plot?
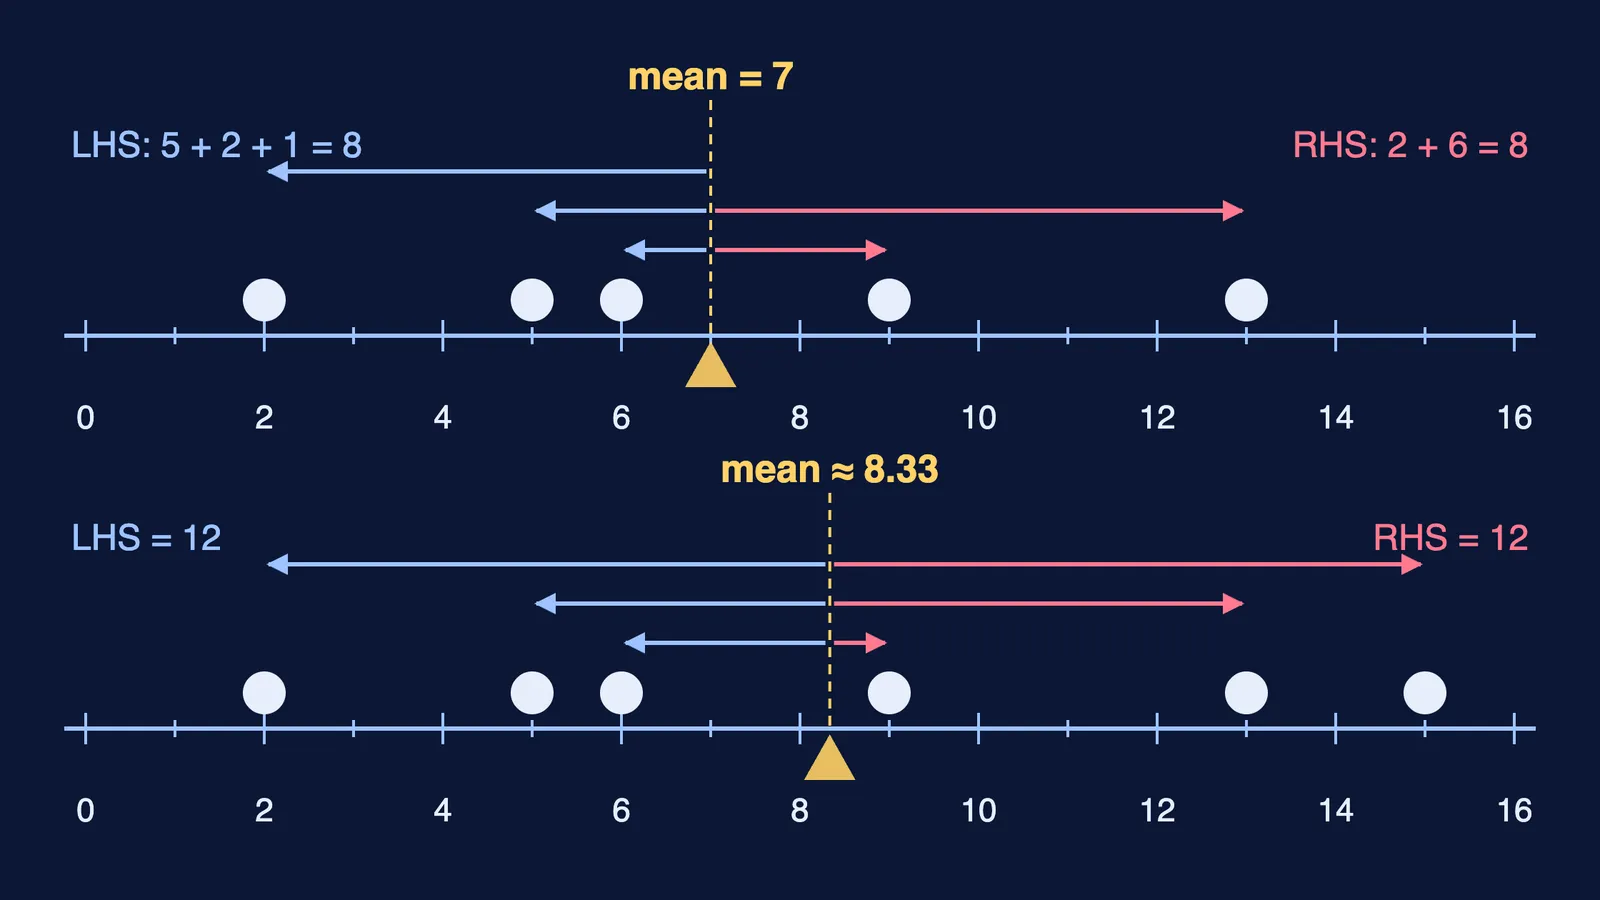
Grade 7 treated the mean as a fair share. This chapter adds a picture: on a dot plot, the distances of values below the mean add up to the same total as the distances of values above it (Chapter 5, NCERT). The mean need not sit halfway between the extremes.
Take 2, 5, 6, 9 and 13. The sum is 35, so the mean is 35 ÷ 5 = 7.
Left of 7: distances 5, 2 and 1, total 8.
Right of 7: distances 2 and 6, total 8.
There is only one such centre: move the point either way and the two totals stop matching.
What happens when the data changes?
Include 15 (above the mean): 50 ÷ 6 ≈ 8.33. The mean rises, and both sides now total 12, as the diagram shows.
Include 3 (below the mean): 38 ÷ 6 ≈ 6.33. The mean falls.
Include 7 (equal to the mean): 42 ÷ 6 = 7. No change.
Add 4 to every value: the mean becomes 11.
Double every value: the mean becomes 14.
The book proves cases 4 and 5 with algebra. The median behaves similarly: for 2, 5, 6, 9, 13 it is 6, and including 10 gives 2, 5, 6, 9, 10, 13 with median (6 + 9) ÷ 2 = 7.5.
How do you find a missing value or correct a wrong mean?
Use total = mean × number of values.
Missing value. Seven match scores are 34, 18, 52, 27, 41, 23 and a smudged r, with mean 32. Total = 32 × 7 = 224. The known scores add to 195, so r = 29.
Wrong entry. Twenty readings have mean 46.5, but one was written 6 too high. Wrong total = 930, correct total = 924, correct mean = 924 ÷ 20 = 46.2.
Frequency tables. Thirty students read 1 book (4 students), 2 (9), 3 (8), 4 (5), 5 (3) or 6 (1) in a month. Multiply each value by its frequency: 4 + 18 + 24 + 20 + 15 + 6 = 87, so the mean is 87 ÷ 30 = 2.9. The median is the average of the 15th and 16th values; running totals 4, 13, 21 show positions 14 to 21 are all 3, so the median is 3.
Spreadsheets come next: ranges written Start:End and formulas like =SUM(B2:B9) or =AVERAGE(C2:C31).
How do you read a line graph in Class 8?
A line graph joins data points with line segments and is mostly used to show change over time (Chapter 5, NCERT). The book reads each graph in two steps:
Identify what is given: axes, scale, what each line means, the pattern.
Infer and interpret: describe rises, falls and flat stretches, then summarise.
A steeper segment means a bigger change. Asking how the data was collected shows its limits. With many points, a line graph stays readable where a clustered column graph gets crowded. The chapter also covers infographics, activity strips of 48 half-hour boxes and a data story on sleep.
Practice questions for Tales by Dots and Lines
Marks are our suggestion.
(1 mark) The mean of 7, 12, 14, 19 is 13. What is the mean after adding 6 to each value?
(2 marks) Six values have mean 18. The value 30 is removed. Find the new mean.
(2 marks) For 3, 8, 12, 15, 21, 26, which single values can you include so the new median is 12?
(3 marks) A library had 24, 30, 27, 39, 45 and 21 visitors from Monday to Saturday. Draw a line graph. Name the steepest rise and steepest fall between neighbouring days, and find the mean and median.
Answers: (1) 19. (2) (108 − 30) ÷ 5 = 15.6. (3) Any value of 12 or less. (4) Steepest rise Wednesday to Thursday (+12), steepest fall Friday to Saturday (−24); mean 186 ÷ 6 = 31; median (27 + 30) ÷ 2 = 28.5.
How does this chapter connect to the rest of Ganita Prakash?
It builds on Grade 7's mean and median, uses algebra ahead of Chapter 6, Algebra Play, and its sleep-time graph recalls the pie chart from Chapter 3, Proportional Reasoning-2. Compare the older Class 8 data handling guide, revisit Part I with our Story of Numbers Class 8 guide, or look ahead to weighted means in Class 9's How Quantities Combine.
Not sure where to begin revising? Fermi's AI tutor works out what you already know and builds a plan for the session.