On this page
These notes cover five ideas from the Class 9 population chapter: size, distribution, density, growth and age composition. Each gets a one-line definition and its official Census 2011 figure, plus a worked growth-rate example you can redo in an exam.
NCERT has released a new Class 9 social science textbook for 2026-27, Understanding Society: India & Beyond – Part 2, according to this report on the new NCERT books. Check which book your school uses; the figures below come from official government publications, not either textbook.
What are the key Census 2011 figures for population Class 9?
The provisional totals of Census 2011 put India's population on 1 March 2011 at 1,210,193,422, up from 1,028,737,436 in 2001, according to the Ministry of Statistics (MoSPI) area and population chapter. The same chapter says India has 2.4% of the world's surface area but 17.5% of its population.
The Census 2011 population was 121.1 crore, according to the MoSPI Women and Men in India 2022 population chapter.
The United Nations projected in April 2023 that India would reach 1,425,775,850 people by the end of that month, matching and then passing mainland China. For how the count itself is done, read our explainer on how India conducts its census.
How is India's population distributed, and what is population density?
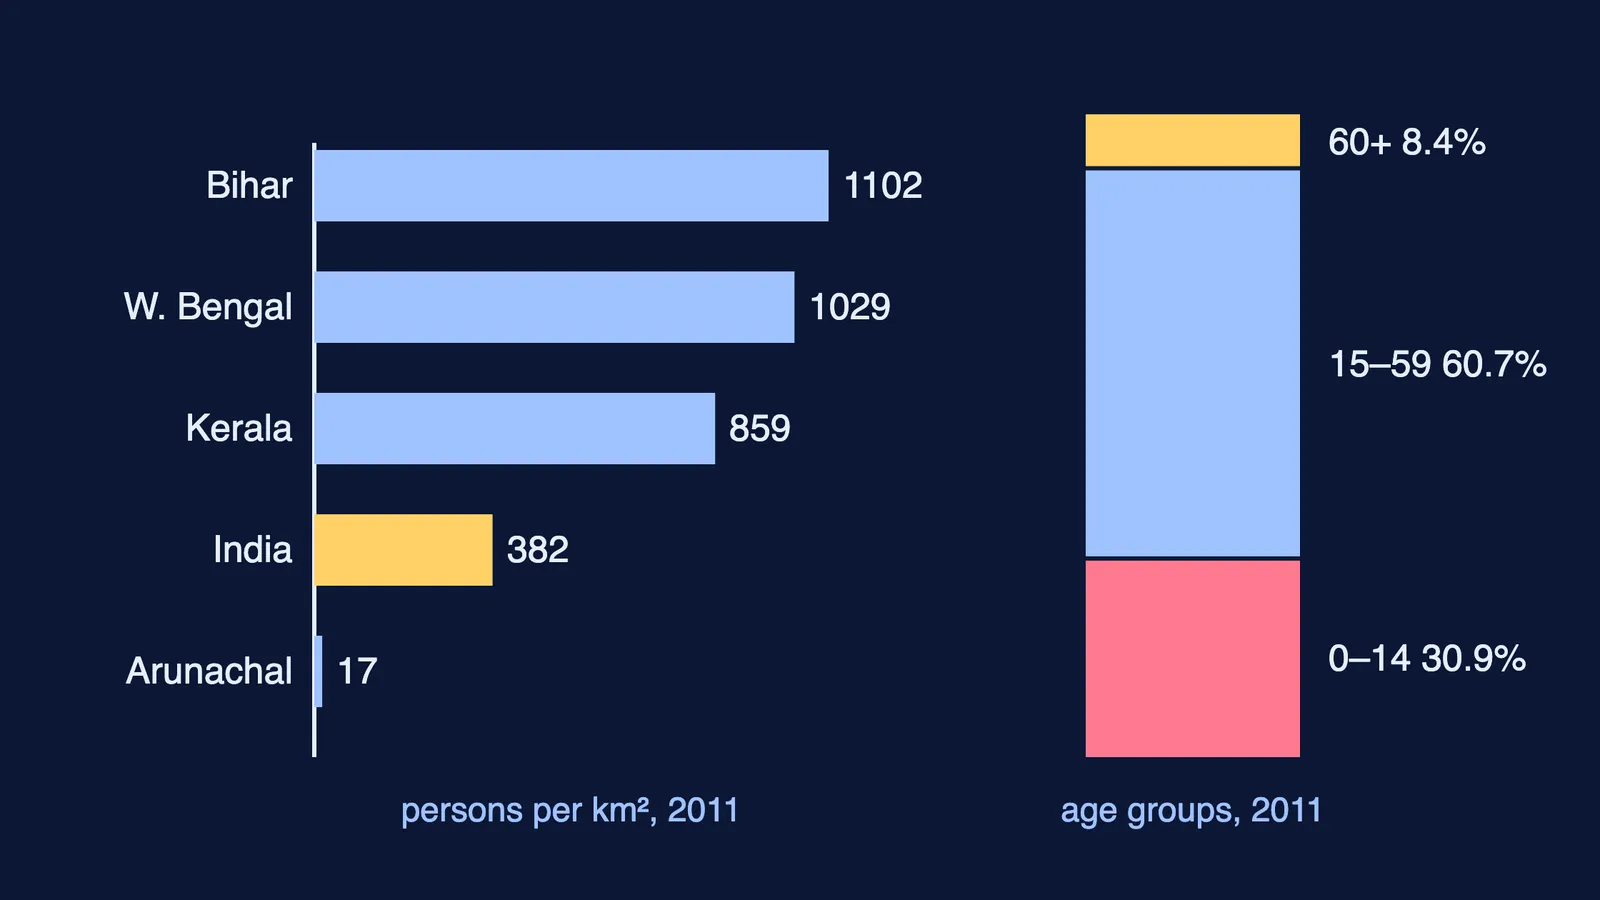
Population density is the number of persons per square kilometre, as defined in the MoSPI area and population chapter. India's density rose from 325 persons per square kilometre in 2001 to 382 in 2011, so on average 57 more people live on every square kilometre.
The spread is very uneven (same MoSPI chapter):
Uttar Pradesh is the most populous state, with almost 200 million people, and Maharashtra is second.
Among the major states, Bihar is the most densely populated (1,102 per square kilometre), followed by West Bengal (1,029) and Kerala (859).
Arunachal Pradesh is the least densely populated state, with 17 per square kilometre.
NCT of Delhi (11,297) and Chandigarh (9,252) have the highest densities of all.
MoSPI puts these differences down to climate, physical features and resources. In an answer, give each dense region a reason (flat plains, fertile soil) and each sparse one a constraint (rugged terrain, dense forest).
How do you calculate population growth rate?
Growth is measured in two ways. Absolute increase is the later population minus the earlier one. Growth rate is that increase as a percentage of the earlier population. Here is a worked example using the MoSPI provisional figures:
Absolute increase = 1,210,193,422 − 1,028,737,436 = 181,455,986, or about 181.5 million.
Decadal growth rate = 181,455,986 ÷ 1,028,737,436 × 100 = 17.64%.
Average yearly rate: 1.1764 to the power 1/10 is about 1.0164, so the population grew roughly 1.64% a year.
Step 3 is optional; it shows why 17.64% in ten years is not 1.764% a year, because each year's growth builds on the last. The MoSPI Women and Men in India 2022 chapter shows the average annual growth rate falling from 2.2% in 1971 to 1.1% in 2021. To see why growth first sped up and then slowed, read why human population grew so fast.
If the percentage steps trip you up, the Fermi Problem Library has worked problems with a step-by-step solver that explains the reasoning rather than printing an answer.
What is age composition, and why does it matter?
Age composition is how a population is divided into age groups. The MoSPI Women and Men in India 2022 chapter cites the Technical Group on Population Projections: in 2011, 30.9% of Indians were aged 0-14, 60.7% were aged 15-59, and 8.4% were 60 or older. That working-age 60.7% was 735 million people.
The dependency ratio is the number of children (0-14) and older people (60 and over) for every 100 people of working age (15-59). The same chapter gives it as 64.6 for 2011. Sex ratio is the number of females per 1,000 males; the same chapter gives 943 for 2011.
Census 2011 put the effective literacy rate at 74.04%: 82.14% for males and 65.46% for females, according to the MoSPI area and population chapter.
How should you revise the population chapter?
All figures here come from the MoSPI area and population chapter and MoSPI's Women and Men in India 2022. Here is a 20-minute plan for the night before a test:
Write the five definitions (density, absolute increase, growth rate, age composition, sex ratio) from memory, then check them.
Redo the growth-rate example on blank paper without looking.
Learn six figures, each with its year: 121.1 crore, 17.5%, 2.4%, 382, 17.64% and 60.7%.
Name two dense states and two sparse states, with one reason for each.
Answer one short question out loud: why is population density uneven in India?
Wondering how much Class 9 results count for later on? Read where Class 9 marks matter and where they don't.