On this page
For most of human history, lots of babies were born and almost as many people died young. Then deaths fell sharply, and births took decades to follow. That gap is the story of fast population growth, and the formula for biology and maths questions.
Why did human population grow so fast?
In 1800 there were one billion people, according to Our World in Data's population growth page. The world reached 8 billion people on 15 November 2022, says the United Nations.
Our World in Data sums up the cause in one line: the increase "has been the result of advances in living conditions and health that reduced death rates – especially in children – and increases in life expectancy." Global life expectancy before 1800 was less than 28 years; in 2023 it was 73 years (Our World in Data).
Child survival is a large part of that change. For most of history, around 1 in 2 newborns died before age 15; by 1950 it was about one quarter, and by 2020 it had fallen to 4% (Our World in Data, child mortality).
How did better food and health lower death rates?
A growing population needs more food, and farms delivered it. In India, cereal yield rose from about 947 kg per hectare in 1961 to about 3,602 kg per hectare in 2023, nearly four times as much grain from the same land (World Bank cereal yield indicator).
Child survival kept improving too. India's infant mortality rate fell from 44 per 1,000 live births in 2011 to 25 in 2023, according to the government's Press Information Bureau.
Why did birth rates stay high?
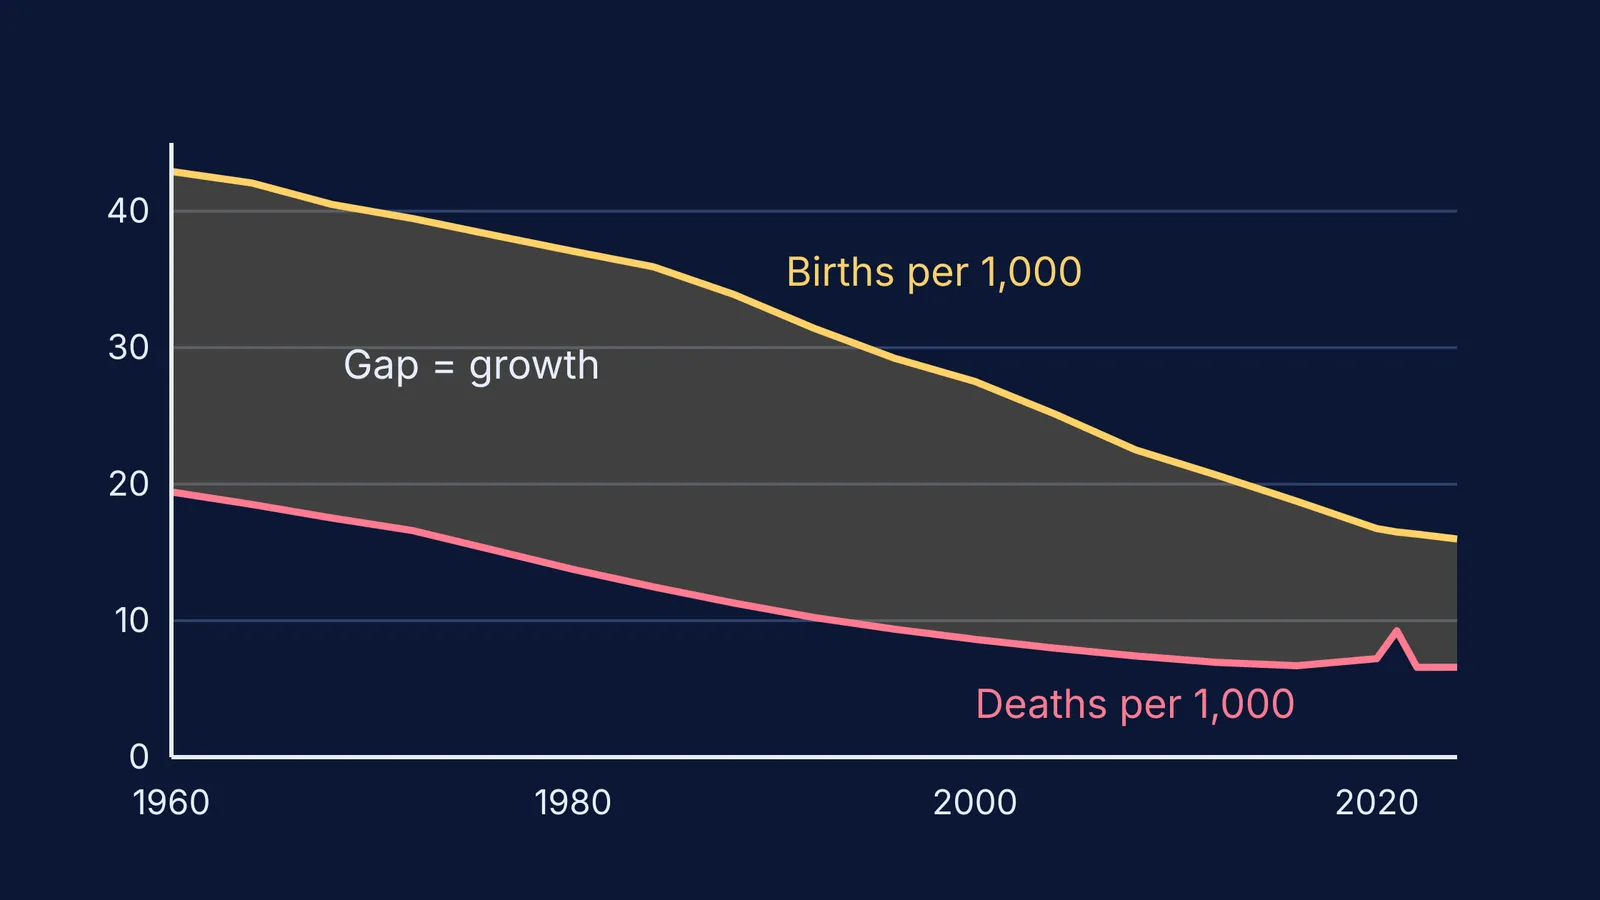
The demographic transition is the model that explains why countries go through a period of rapid population growth (Our World in Data). In it, the fall in the death rate comes first and the fall in the birth rate follows later. As the same page puts it: "If fertility fell in lockstep with mortality, we would not have seen an increase in the population at all."
You can see the lag in India's numbers. Using World Bank birth rate and death rate estimates:
1960: 42.9 births and 19.4 deaths per 1,000 people
1980: 37.1 births and 13.8 deaths per 1,000 people
2024: 16.0 births and 6.6 deaths per 1,000 people
Between 1960 and 1980 the death rate fell by about 29%, but the birth rate fell by only about 14%. So the gap stayed wide, and India kept growing fast. For the history of the worry that people would outgrow food, read Thomas Malthus and the maths of his essay on population.
How do you calculate population growth rate simply?
The crude birth rate is the number of births per 1,000 people in a year, and the crude death rate is the number of deaths per 1,000 people in a year (these are the definitions behind the World Bank indicators). Ignoring migration, the natural growth rate in percent is (birth rate minus death rate) divided by 10.
A worked example:
A town has 50,000 people. In one year there are 1,500 births and 500 deaths.
Birth rate = 1,500 ÷ 50,000 × 1,000 = 30 per 1,000.
Death rate = 500 ÷ 50,000 × 1,000 = 10 per 1,000.
Natural increase = 30 − 10 = 20 per 1,000, which is 20 ÷ 10 = 2% a year, or 1,000 extra people.
Doubling time ≈ 70 ÷ 2 = 35 years. The 70 comes from ln 2 ≈ 0.693; our explainer on the rule of 72 and doubling time shows why this shortcut works.
Now do it for India with the World Bank figures above. In 1960: (42.9 − 19.4) ÷ 10 = 2.35% a year, so the population would double in about 30 years. In 2024: (16.0 − 6.6) ÷ 10 = 0.94% a year, a doubling time of about 74 years.
Sources can differ, though. India's own Sample Registration System put the 2023 birth rate at 18.4 per 1,000, according to the Press Information Bureau release, higher than the World Bank's estimate of about 16.1 for the same year.
For more practice with rates per 1,000, try our step-by-step guide on how to calculate birth rate, death rate and population growth. If you lose track of which term goes where once immigration and emigration come in, the Fermi Problem Library has worked problems with a step-by-step solver that explains the reasoning rather than printing an answer.
Is population growth slowing down now?
Yes. Global population growth peaked in the 1960s at over 2% per year (Our World in Data). The UN notes it took 12 years to go from 7 to 8 billion and will take about 15 years, until 2037, to reach 9 billion. It projects a peak of about 10.3 billion by the mid-2080s (United Nations).
If exponential growth, the J-shaped curve or the demographic transition still feels shaky, the Fermi Concept Library gives each concept its own lesson and shows its place in the map. Then try one tonight: pick a state, find its birth and death rates, and work out its doubling time.