On this page
Human Resources is the chapter in the NCERT Class 8 geography book Resources and Development that treats people as a resource. Below are the textbook's own figures, a worked density sum and a three-question method for pyramids.
A note on books first: in July 2025 NCERT launched a new Class 8 social science textbook, Exploring Society: India and Beyond, as Careers360 reported. Ask your teacher which book your school follows; the ideas below are standard geography either way.
What does human resources mean in Class 8 geography?
NCERT calls human resource the ultimate resource, because nature's bounty becomes significant only when people find it useful (NCERT Class 8, Human Resources). Healthy, educated and motivated people develop resources to suit their needs.
How is population distributed across the world?
The pattern of population distribution is the way people are spread across the earth's surface (NCERT). More than 90 per cent of the world's population lives on about 30 per cent of the land surface, according to the same chapter. Almost three-quarters of the world's people live in Asia and Africa, and 60 per cent live in just 10 countries.
The crowded areas are south and south-east Asia, Europe and north-eastern North America. The sparse ones are high latitudes, tropical deserts, high mountains and equatorial forests. For how India actually counts its people, see our explainer on how the census is conducted in India.
What is population density, and how do you calculate it?
Population density is the number of people living in a unit area of the earth's surface, usually expressed per square kilometre (NCERT). The textbook gives the world average as 51 persons per square km and India's as 382 persons per square km.
Worked example:
A district has 9,00,000 people and an area of 2,500 sq km.
Density = population ÷ area = 9,00,000 ÷ 2,500.
Answer: 360 persons per sq km, a little below the textbook's Indian average of 382.
What factors affect the distribution of population?
NCERT splits the factors into two groups (NCERT).
Geographical factors:
Topography: people prefer plains; the Ganga plains are crowded, while the Andes, Alps and Himalayas are sparsely populated.
Climate: people avoid very hot or very cold places such as the Sahara and the polar regions of Russia, Canada and Antarctica.
Soil: fertile plains of the Ganga and Brahmaputra, the Hwang-He and Chang Jiang, and the Nile are densely populated.
Water: river valleys are crowded; deserts are not.
Minerals: diamond mines in South Africa and oil in the Middle East drew settlers.
Social, cultural and economic factors:
Social: better housing, education and health draw people, for example Pune.
Cultural: places of religious or cultural importance, for example Varanasi, Jerusalem and Vatican City.
Economic: jobs in industrial areas, for example Mumbai and Osaka.
How does population change?
Population change is the change in the number of people during a specific time (NCERT). Birth rate is the number of live births per 1,000 people, death rate is the number of deaths per 1,000 people, and the difference between the two is the natural growth rate. Migration, the movement of people in and out of an area, is the other way numbers change.
The chapter's timeline: the world reached 1 billion people in 1804, 3 billion in 1959 and 6 billion in 1999, mainly because better food and medicine cut deaths while births stayed high. Our post on why human population grew so fast tells that story in more depth, and the next step up is our Class 9 guide to population size, density and growth.
How do you read a population pyramid?
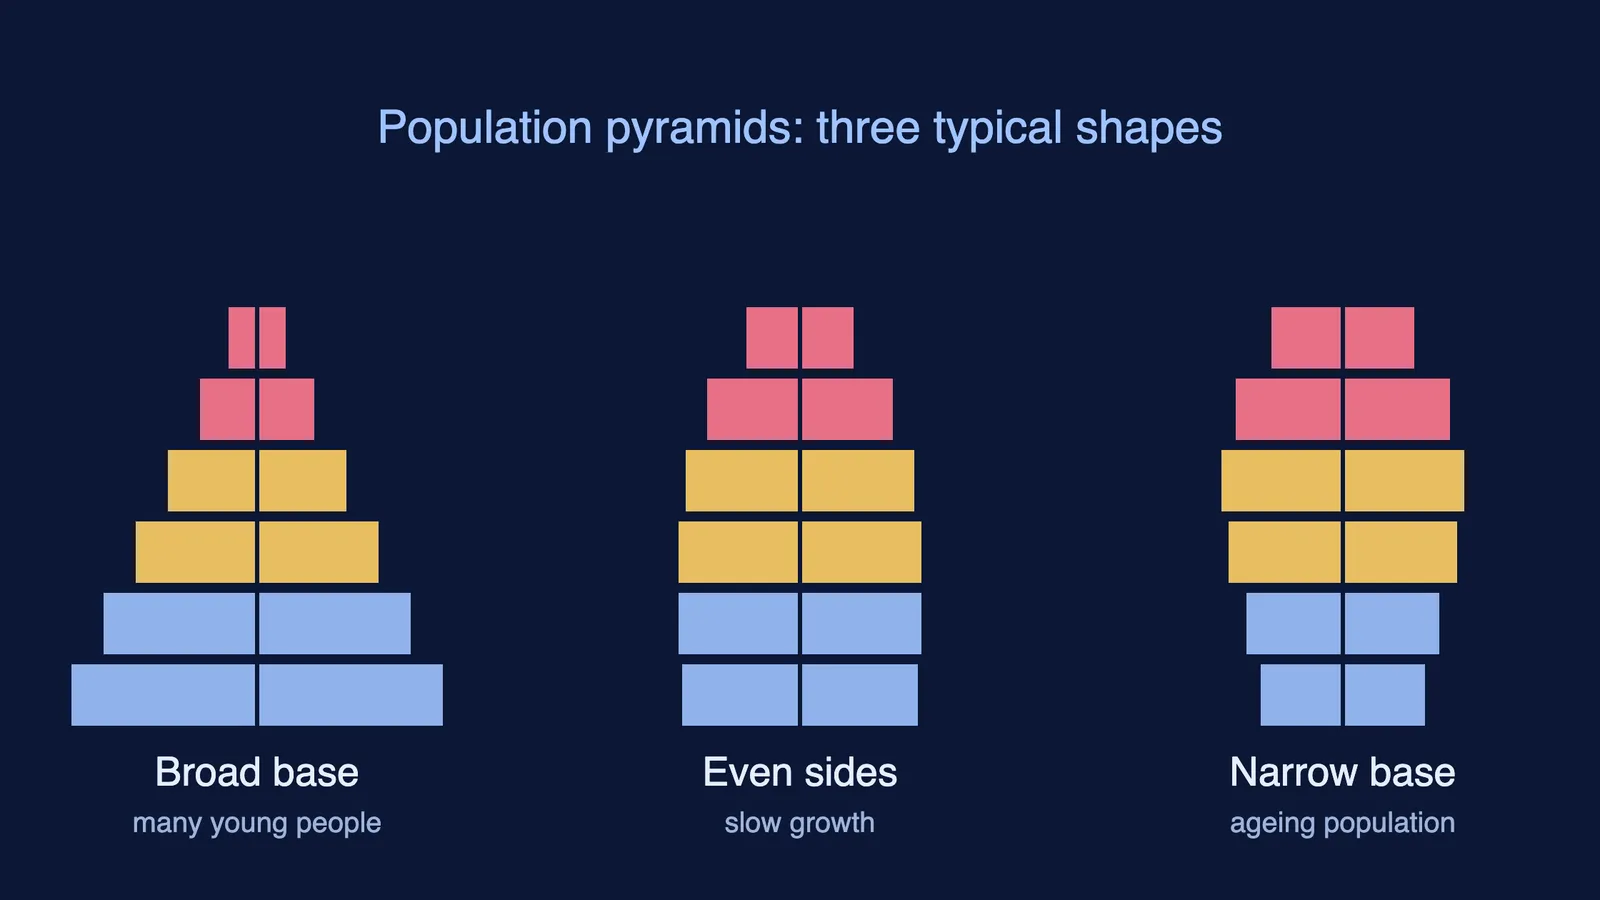
A population pyramid, also called an age-sex pyramid, shows the population divided into age groups, with the percentage of males and females in each (NCERT). Children below 15 sit at the bottom and people above 65 at the top; both are dependents, and everyone in between is of working age.
Ask three questions of any pyramid:
Is the base wide or narrow? A wide base means many births.
How fast does it narrow? Rapid narrowing means many people die young.
Is the top thick or thin? A thicker top means more people reach old age.
Apply them to the textbook's three countries. Kenya: wide base and rapid narrowing, from high birth and death rates. India: broad in the younger groups because more infants now survive, which means a large and expanding labour force. Japan: narrow base from low birth rates, with more people living to old age.
Mixing up the three rates? Put each on a card with its definition and one example, and test yourself the next day. If you are not sure where to start with a chapter, Fermi's AI tutor can work out what you already know and build a plan for the session, so you sit down to a clear next step.