
On this page
Two classes can share an average mark and still look nothing alike. This Class 11 Applied Mathematics chapter measures that difference and explains percentile rank.
What does the 2026-27 syllabus include for this chapter?
In the CBSE Applied Mathematics (241) curriculum for 2026-27, this chapter is in Unit V, Descriptive Statistics, worth 10 marks of the 80-mark Class XI paper. Those 10 marks also cover correlation and regression.
The curriculum lists range, mean deviation, variance and standard deviation (ungrouped and grouped data) and percentile rank for ungrouped data. The CBSE Applied Mathematics XI student support material (second edition, April 2026) teaches these in Chapter 10, plus quartile deviation and grouped percentile rank, which the curriculum list does not name; ask your teacher if they are tested.
Core Mathematics has its own chapter; our Class 11 Maths statistics guide covers it.
How do range, quartile deviation and standard deviation differ?
Dispersion means how far the values in a data set spread, or how far they sit from their average, as the support material puts it.
Range = max − min; coefficient of range = (max − min) / (max + min).
Quartile deviation (Q.D.) = (Q₃ − Q₁) / 2, where Q₁ and Q₃ are the first and third quartiles. For ungrouped data, Q₁ is the (n + 1)/4th value and Q₃ is the 3(n + 1)/4th value after sorting.
Mean deviation about the mean = Σ|xᵢ − x̄| / n.
Variance σ² = Σ(xᵢ − x̄)² / N (the book divides by N); standard deviation σ is its square root.
The book's rule of thumb: range for a quick look, Q.D. when the median is your average, σ when the mean is.
Worked example: two sections, same mean
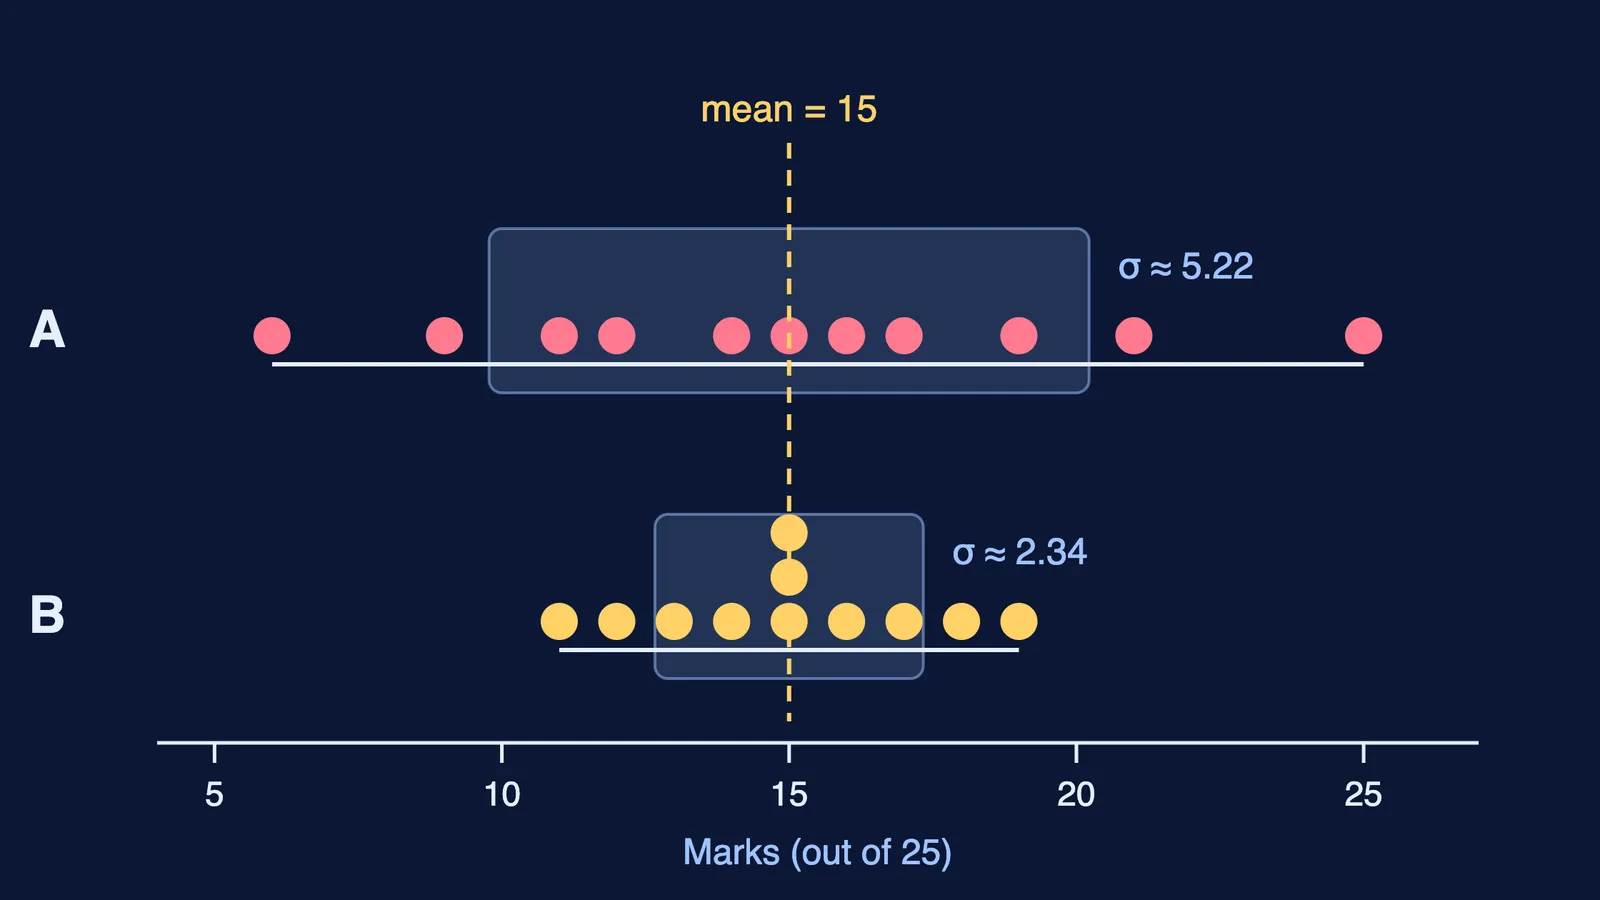
Our own marks out of 25 for two sections of 11 students, sorted:
Section A: 6, 9, 11, 12, 14, 15, 16, 17, 19, 21, 25
Section B: 11, 12, 13, 14, 15, 15, 15, 16, 17, 18, 19
Both means are 165/11 = 15.
Range: A = 25 − 6 = 19; B = 19 − 11 = 8. Coefficient of range: A = 19/31 ≈ 0.61; B = 8/30 ≈ 0.27.
Quartiles: n = 11, so Q₁ is the 3rd value and Q₃ the 9th. A: Q₁ = 11, Q₃ = 19, Q.D. = 4. B: Q₁ = 13, Q₃ = 17, Q.D. = 2.
A: deviations from 15 are −9, −6, −4, −3, −1, 0, 1, 2, 4, 6, 10; squares total 300, so σ² = 300/11 ≈ 27.27 and σ ≈ 5.22 marks. Mean deviation = 46/11 ≈ 4.18 marks.
B: squared deviations total 60, so σ² ≈ 5.45 and σ ≈ 2.34 marks.
Every measure agrees: Section B is more consistent.
How is percentile rank calculated, and how do exam percentiles work?
Percentile rank (PR) is the percentage of observations below a given value. For ungrouped data, the support material works in three steps: arrange the data in ascending order, find the rank position R of the score, then apply PR = 100 − (100R − 50)/N, where N is the number of items.
Here rank 1 is the highest score, so the top mark gets the highest PR, as the book requires. Its answer key fits this: multiple-choice question 5 and Exercise 12 work out with R counted from the top, and Exercise 12 gives tied scores the middle of their ranks. Example 15's score is the median, 7th from either end. Write the book's form in your exam.
A checking helper: counting position k up from the lowest score, k = N + 1 − R and PR = (100k − 50)/N.
Take 17 marks. In A it is 4th from the top: PR = 100 − (400 − 50)/11 ≈ 68.18. In B it is 3rd: PR = 100 − (300 − 50)/11 ≈ 77.27. The same score ranks higher in the tighter group.
Large national exams publish their own formulas; our explainer on JEE Main normalisation walks through one.
What practice questions should you try?
Our own questions; mark labels are our suggestion, not CBSE's.
(1 mark) Find the range and coefficient of range of 6, 13, 9, 22, 15.
(2 marks) Find the quartile deviation of 3, 7, 8, 10, 12, 15, 21.
(3 marks) Work out σ² and σ for 4, 8, 9, 10, 14.
(3 marks) Twelve students scored 18, 22, 25, 27, 30, 31, 33, 35, 36, 38, 40, 44. Find the percentile rank of 30.
Answers: 1. 16 and 16/28 ≈ 0.57. 2. Q₁ = 7, Q₃ = 15, Q.D. = 4. 3. mean 9, σ² = 10.4, σ ≈ 3.22. 4. R = 8 from the top, PR = 37.5.
How should you revise this chapter?
Sort the data first; quartiles and PR go wrong on unsorted data.
Write the unit with every answer and say which set is more consistent.
Not sure where to start? Fermi's AI tutor works out what you already know, builds a plan for the session, and teaches through it. Other chapters are in our CBSE Applied Mathematics guide.