
On this page
Correlation asks how two variables move together. Here is the 2026-27 syllabus, one worked example done three ways, and a practice set.
What does the 2026-27 curriculum include for correlation?
The CBSE Applied Mathematics (241) curriculum for 2026-27 places correlation in Class 11 Unit V, Descriptive Statistics. It lists the concept of correlation, Karl Pearson's coefficient and Spearman's rank correlation, both for ungrouped data.
Unit V carries 10 marks out of 80 in the theory paper, and those 10 marks are shared with measures of dispersion, percentiles and regression. CBSE prints no separate figure for correlation.
The study text is the CBSE Applied Mathematics Class XI student support material (second edition, April 2026), where Chapter 11 is Correlation Analysis. It covers scatter diagrams, Pearson's r, and Spearman's method with distinct and repeated ranks.
How is this different from the Economics correlation chapter?
The ideas match our Class 11 Economics correlation guide; the emphasis differs. The Applied Maths book teaches three routes to r, including the assumed-mean method, shows the spreadsheet functions =CORREL and =PEARSON alongside the hand methods, and leads straight into regression in Chapter 12. The curriculum's suggested projects include spreadsheet scatter plots of weather, inflation or AQI data.
Mathematics (041) has no correlation topic in its 2026-27 Class 11 curriculum, so there is no core-maths version to compare. Our guide to choosing Applied Mathematics explains how the two subjects differ overall.
How do you calculate Karl Pearson's coefficient?
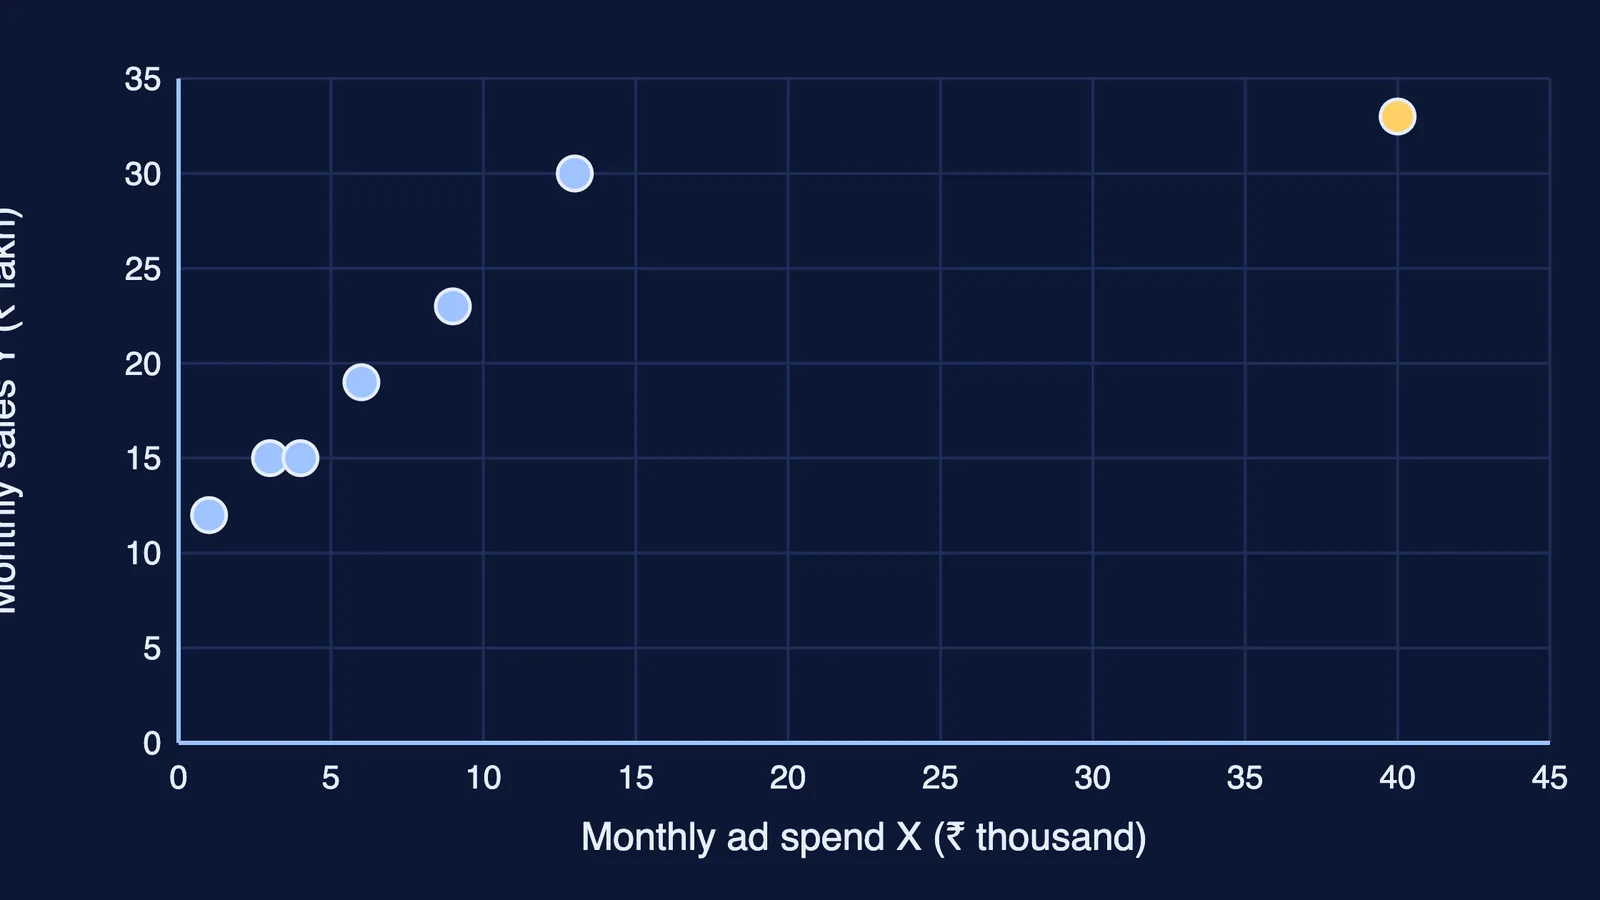
Six shops record monthly ad spend X (₹ thousand) and sales Y (₹ lakh).
X: 1, 3, 4, 6, 9, 13
Y: 12, 15, 15, 19, 23, 30
Direct method. The means are 36/6 = 6 and 114/6 = 19. Deviations x = X − 6 are −5, −3, −2, 0, 3, 7, and y = Y − 19 are −7, −4, −4, 0, 4, 11.
Σxy = 35 + 12 + 8 + 0 + 12 + 77 = 144
Σx² = 25 + 9 + 4 + 0 + 9 + 49 = 96
Σy² = 49 + 16 + 16 + 0 + 16 + 121 = 218
r = Σxy / √(Σx² × Σy²) = 144 / √20928 = 144 / 144.67 ≈ 0.995, a very high positive correlation.
Now add a seventh shop that spends 40 and sells 33. Use the actual-values method: n = 7, ΣX = 76, ΣY = 147, ΣXY = 2148, ΣX² = 1912, ΣY² = 3473.
r = (nΣXY − ΣXΣY) / √[(nΣX² − (ΣX)²)(nΣY² − (ΣY)²)] = (15036 − 11172) / √(7608 × 2702) = 3864 / 4534.0 ≈ 0.852.
One big spender that does not sell far more pulled r from 0.995 to 0.852. The scatter diagram above shows the seventh point well off the line the others follow.
How do you calculate Spearman's rank correlation with tied ranks?
The book's steps rank in descending order (largest value gets rank 1), though Example 6 ranks lowest first; either order works if both variables use it. Equal values share the average of the ranks they would take.
For the seven shops, X ranks are 7, 6, 5, 4, 3, 2, 1. Sales of 15 appear twice, in places 5 and 6, so both get 5.5: Y ranks are 7, 5.5, 5.5, 4, 3, 2, 1.
The rank differences d are 0, 0.5, −0.5, 0, 0, 0, 0, so Σd² = 0.5. With one value repeated m = 2 times, the correction is m(m² − 1)/12 = 2 × 3 / 12 = 0.5.
rₛ = 1 − 6[Σd² + m(m² − 1)/12] / [n(n² − 1)] = 1 − 6 × 1 / (7 × 48) = 1 − 6/336 ≈ 0.982.
Spearman barely moves because the big spender still ranks first on both lists; as the book notes, the rank method is not sensitive to outliers. To watch one point move Pearson's r, try our drag-the-points correlation demo.
Does correlation mean causation?
No. The book states that correlation may not always imply causation and calls a correlation with no cause-and-effect link spurious or non-sense correlation. Our shops' sales rise with ad spend, but bigger shops may simply spend more and sell more; r cannot tell you which.
Practice questions (with answers)
These are our own questions; the mark labels are our suggestion.
(1 mark) The correlation between X and Y is 0.6. Find r between U = 2X + 5 and V = 4 − 3Y. Answer: −0.6. Adding a constant or a positive multiplier leaves r unchanged; a negative multiplier flips its sign.
(2 marks) For 8 pairs with no tied ranks, Σd² = 10. Find rₛ. Answer: 1 − 60/504 ≈ 0.881.
(3 marks) Across 10 city wards, the number of clinics and the number of reported illnesses have r = 0.9. Does opening clinics cause illness? Answer: no; ward population could raise both.
Stuck on where a calculation went wrong? The Fermi Problem Library has worked problems with a step-by-step solver that explains the reasoning rather than printing an answer.