
On this page
Comparative and common-size statements are the two tools the NCERT chapter on analysis of financial statements works through step by step. This guide checks the current syllabus, textbook and sample paper, then works one original example.
Where are they in the 2026-27 CBSE Accountancy syllabus?
The CBSE Accountancy curriculum for 2026-27 lists Analysis of Financial Statements at 12 marks under Part B, Financial Statement Analysis, with Cash Flow Statement at 8 marks. It names comparative and common size statements as analysis tools, and a learning outcome asks you to prepare both and know the difference.
Part B is an option: students may take Computerized Accounting instead, so check which your school follows.
In the CBSE 2026-27 sample question paper, question 31 is a 3-mark question with an internal choice: a comparative statement of profit and loss, or a common size statement of profit and loss. The marking scheme solves both.
The textbook chapter is Chapter 4, Analysis of Financial Statements, in NCERT Accountancy Part 2, marked Reprint 2026-27.
What is the difference between comparative and common-size statements?
NCERT Chapter 4 defines both:
A comparative statement shows a firm's figures for two or more periods side by side, with the change in absolute and percentage terms. NCERT also calls this horizontal analysis.
A common-size statement shows each item as a percentage of a common base. NCERT also calls this vertical analysis.
For the base, NCERT suggests revenue from operations for the statement of profit and loss, and total assets or total liabilities for the balance sheet.
Percentage change = (Year 2 − Year 1) ÷ Year 1 × 100
Common-size percentage = Item ÷ Base × 100
Because the figures sit on a common base, the chapter notes, common-size statements also let you compare companies of different sizes.
Worked example: a comparative statement of profit and loss
Neel Crafts Ltd. is a made-up company. Figures are for 2024-25 and then 2025-26, with tax at 25%. Each line gives Year 1, Year 2, absolute change and percentage change.
Revenue from operations: ₹40,00,000; ₹50,00,000; +₹10,00,000; +25%
Other income: ₹2,00,000; ₹1,50,000; −₹50,000; −25%
Total revenue: ₹42,00,000; ₹51,50,000; +₹9,50,000; +22.62%
Cost of materials consumed: ₹24,00,000; ₹31,00,000; +₹7,00,000; +29.17%
Employee benefit expenses: ₹6,00,000; ₹7,00,000; +₹1,00,000; +16.67%
Other expenses: ₹4,00,000; ₹4,50,000; +₹50,000; +12.5%
Total expenses: ₹34,00,000; ₹42,50,000; +₹8,50,000; +25%
Profit before tax: ₹8,00,000; ₹9,00,000; +₹1,00,000; +12.5%
Tax at 25%: ₹2,00,000; ₹2,25,000; +₹25,000; +12.5%
Profit after tax: ₹6,00,000; ₹6,75,000; +₹75,000; +12.5%
Every percentage divides by the 2024-25 figure. Revenue from operations grew 25%, but profit after tax grew only 12.5%. The comparative statement shows the gap; the common-size statement explains it.
Worked example: a common-size statement of profit and loss
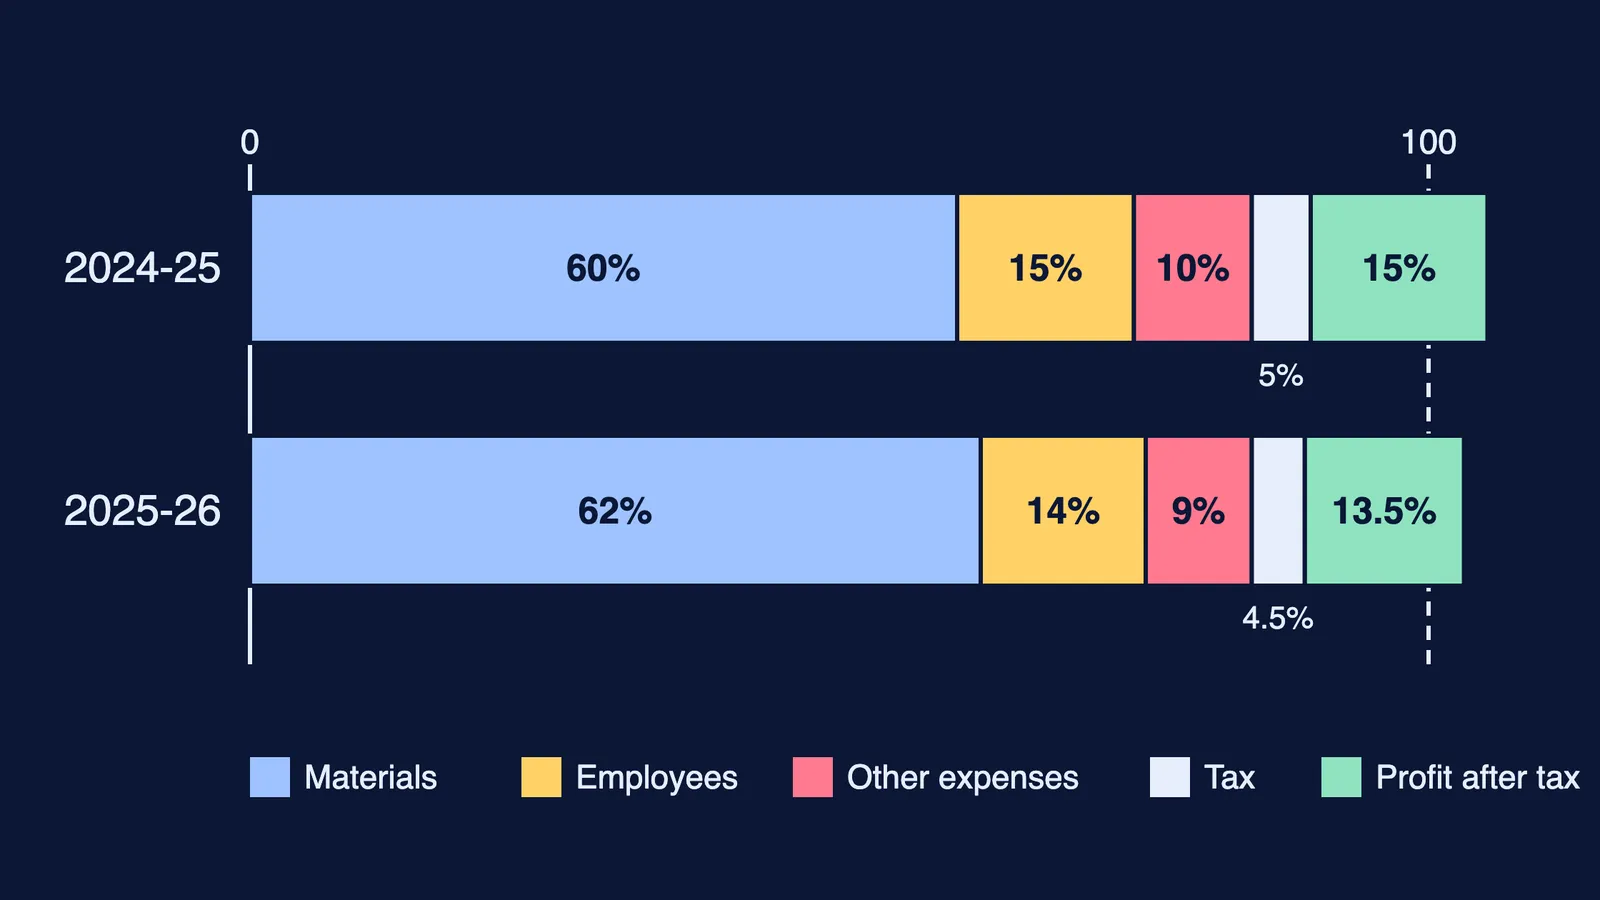
Same company, with revenue from operations as the base (100). Each line gives 2024-25, then 2025-26.
Revenue from operations: 100; 100
Other income: 5; 3
Total revenue: 105; 103
Cost of materials consumed: 60; 62
Employee benefit expenses: 15; 14
Other expenses: 10; 9
Total expenses: 85; 85
Profit before tax: 20; 18
Tax: 5; 4.5
Profit after tax: 15; 13.5
Expenses took the same 85% of revenue from operations in both years. Inside that, materials rose 2 points while employee and other expenses each fell 1 point. Profit before tax slipped from 20 to 18 because other income fell from 5 to 3.
Which mistakes should you avoid?
Dividing by the wrong year. Percentage change uses the earlier year. Dividing the ₹10,00,000 rise by Year 2 gives 20%, not 25%.
Using total revenue as the base. In the sample-paper marking scheme, other income appears as 5 and total revenue as 105, because the base is revenue from operations. Using total revenue for Neel Crafts in 2025-26 would put materials at 60.19 instead of 62.
Losing the sign. Show decreases with a minus sign or brackets, as NCERT does.
Taking tax on the change. Work out tax for each year first, then compare.
Mixing bases in a balance sheet. Every item goes over the same total.
Rounding early. Round only the final percentage.
If percentages themselves feel shaky, the Fermi Concept Library has every concept in physics, chemistry, biology, mathematics and computing, each with its own lesson, so you can revise the maths before the next statement.
What are the limitations of these tools?
NCERT Chapter 4 lists limitations of financial analysis, including these:
It does not consider price level changes.
It can mislead if you do not know about changes in the firm's accounting procedures.
It considers only monetary information and ignores non-monetary aspects.
For Neel Crafts, a 25% rise in revenue could partly reflect higher prices rather than more sales.
Next in the same part of the syllabus, ratio analysis with every Class 12 formula builds on these percentages, and the cash flow statement format with a solved example completes it.