
On this page
Time-based Data is Unit VI of CBSE Class 12 Applied Mathematics (241). You learn to split a series of yearly figures into its parts and draw the long-term trend in two ways.
What does the 2026-27 syllabus include?
The CBSE Applied Mathematics curriculum for 2026-27 gives Unit VI, Time-based data, 06 of the 80 theory marks. It covers the meaning of a time series, its four components, the secular trend, fitting a straight-line trend to univariate data, and two methods of measuring trend: moving averages and least squares.
For study material, CBSE publishes its Applied Mathematics XII support material, Chapter 6. That chapter opens with index numbers, which are not in the 2026-27 unit list, so skip them. It also lists the graphical and semi-averages methods, but the curriculum names only moving averages and least squares.
Our guide to what Applied Mathematics covers and who should choose it compares it with Mathematics (041).
What are the four components of a time series?
A time series is one variable recorded at successive, evenly spaced times. The support material splits its movement into four parts:
Secular trend: the smooth, long-run rise or fall over many years.
Seasonal variation: a pattern that repeats within each year, driven by weather, festivals or habits.
Cyclical variation: an up-and-down swing whose cycle lasts more than a year, like a business boom and slowdown.
Irregular variation: short, unpredictable shocks such as a flood or a strike.
How do you find the trend by moving averages?
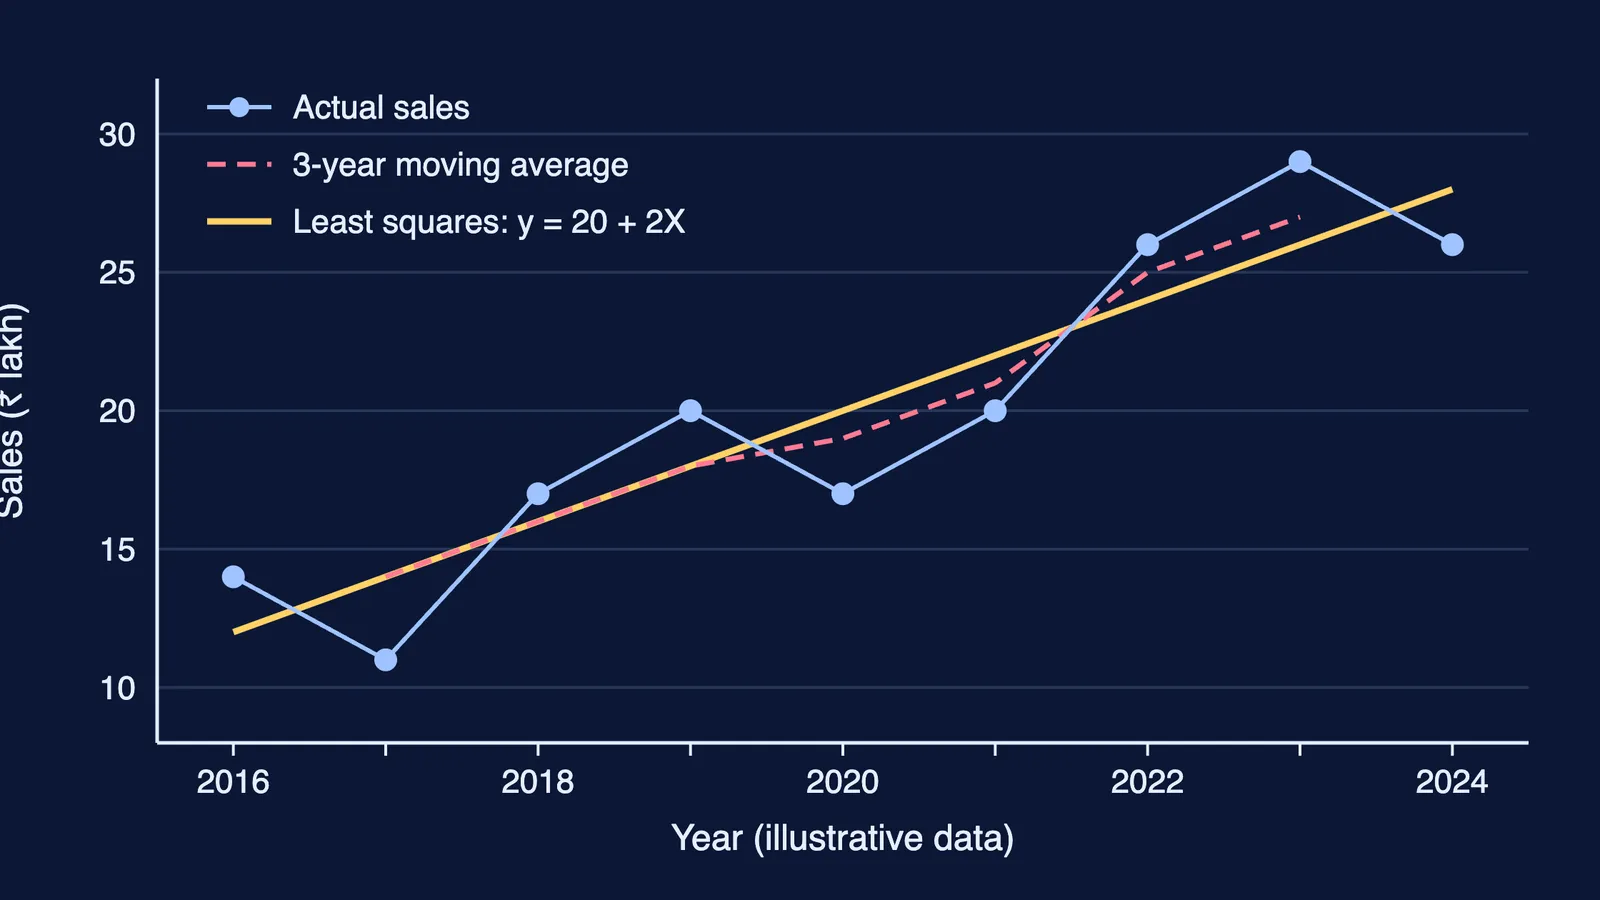
Take the illustrative data in the chart: a stationery shop's yearly sales in ₹ lakh, 2016 to 2024, made up for this guide: 14, 11, 17, 20, 17, 20, 26, 29, 26.
For a 3-year moving average, add the first three values and write the total against the middle year: 14 + 11 + 17 = 42, against 2017. Drop the first year, add the next one, and repeat. The totals are 42, 48, 54, 57, 63, 75, 81. Divide each by 3 to get the trend values for 2017 to 2023: 14, 16, 18, 19, 21, 25, 27. The first and last years get no value.
For an even period such as 4 years, each total sits between two years. Average consecutive 4-year averages in pairs to centre them on a year. Our explainer on odd and even moving averages with centring works through it.
How do you fit a straight-line trend by least squares?
The trend line is y = a + bX. Least squares picks a and b so that the sum of squared gaps between actual and trend values is as small as possible. With n odd, put the origin at the middle year so that ΣX = 0. Then a = ΣY / n and b = ΣXY / ΣX².
For our data, the middle year is 2020, so X runs from −4 to 4.
ΣY = 180, n = 9, so a = 20
ΣX² = 2(1 + 4 + 9 + 16) = 60
ΣXY = −56 − 33 − 34 − 20 + 0 + 20 + 52 + 87 + 104 = 120, so b = 2
The trend is y = 20 + 2X, with X = year − 2020. The trend values run 12, 14, 16 up to 28. For 2026, X = 6 and y = 32, so the trend estimate is ₹32 lakh.
When n is even, take the midpoint of the two middle years as origin and use X = (year − midpoint) / 0.5, giving X = −5, −3, −1, 1, 3, 5 for six years.
Stuck on a step? Fermi's AI tutor is a one-to-one AI tutor that teaches, explains and works through problems alongside the student.
How is it tested, and what should you practise?
The CBSE 2026-27 sample question paper tests this unit with a 1-mark MCQ on the least squares idea and a 5-mark long-answer question. The 5-mark question is an internal choice between a 4-year centred moving average and a least squares fit with a forecast. The marking scheme gives separate marks for the 4-yearly moving totals, the 4-yearly moving averages, the centred totals and the centred moving averages, so show every column.
Practise with these original questions (data illustrative; mark labels follow the sample paper):
(1 mark, MCQ) Ice-cream sales rise every summer and fall every winter. Which component is this? Answer: seasonal variation.
(5 marks) Find the 4-year centred moving averages for 2017 to 2024: 30, 34, 38, 36, 40, 46, 44, 48. Answer: 35.75, 38.5, 40.75 and 43 for 2019 to 2022.
(5 marks) Fit a least squares line to 2019 to 2024 values 6, 10, 9, 13, 15, 19 and estimate 2025. Answer: X = (year − 2021.5) / 0.5, a = 72 / 6 = 12, b = 84 / 70 = 1.2, so y = 12 + 1.2X; for 2025, X = 7 and y = 20.4.
Work each one in a table before checking the answer.