
On this page
Chapter 13 of the NCERT Class 10 Mathematics textbook (Reprint 2026-27) takes mean, median and mode from raw lists to grouped frequency tables. The CBSE Class X Mathematics curriculum for 2026-27 lists "Mean, median and mode of grouped data (bimodal situation to be avoided)" for this chapter. For the concepts behind these formulas, read our Statistics Class 10 chapter guide.
All examples use one original table: minutes of homework for 40 students, in classes 0-20, 20-40, 40-60, 60-80 and 80-100 with frequencies 5, 8, 12, 9 and 6. The 2026-27 NCERT chapter has no section on drawing ogives and does not use the formulas for unequal class sizes, so neither is covered here.
Class marks, class size and cumulative frequency
Class mark: xᵢ = (upper class limit + lower class limit) / 2.
Class size: h = upper limit − lower limit of a class (the median and mode formulas assume all classes have the same h).
Number of observations: n = Σfᵢ, the sum of all frequencies.
Cumulative frequency (cf) of a class: the sum of the frequencies of all classes up to and including it.
Ungrouped median: arrange the data in ascending order. If n is odd, take the ((n + 1)/2)th value; if n is even, average the (n/2)th and (n/2 + 1)th values.
Continuous classes: if classes have gaps (10-19, 20-29), subtract half the gap from each lower limit and add it to each upper limit (9.5-19.5, 19.5-29.5) before using the mode or median formula.
Worked example: the class 20-40 has class mark (20 + 40)/2 = 30 and h = 20. Adding frequencies down the table gives cumulative frequencies 5, 13, 25, 34 and 40, so n = 40.
Watch for: in a gapped table, l is the adjusted boundary (9.5), not the printed limit (10).
How do you find the mean of grouped data?
All three methods give the same answer; the last two shrink the arithmetic.
Direct method: x̄ = Σfᵢxᵢ / Σfᵢ, where xᵢ is the class mark and fᵢ its frequency.
Assumed mean method: x̄ = a + Σfᵢdᵢ / Σfᵢ, where a is the assumed mean (usually a central class mark) and dᵢ = xᵢ − a.
Step-deviation method: x̄ = a + h × (Σfᵢuᵢ / Σfᵢ), where uᵢ = (xᵢ − a)/h and h ≠ 0 (usually the class size).
Condition: each class's frequency is assumed to be centred at its class mark, so the grouped mean is an estimate of the true mean.
Worked example: class marks are 10, 30, 50, 70 and 90. Take a = 50 and h = 20, so uᵢ = −2, −1, 0, 1, 2. Then Σfᵢuᵢ = −10 − 8 + 0 + 9 + 12 = 3, and x̄ = 50 + 20 × 3/40 = 51.5 minutes.
Watch for: dividing by the number of classes (5) instead of Σfᵢ (40), or forgetting the final "× h" in the step-deviation method.
How do you find the mode of grouped data?
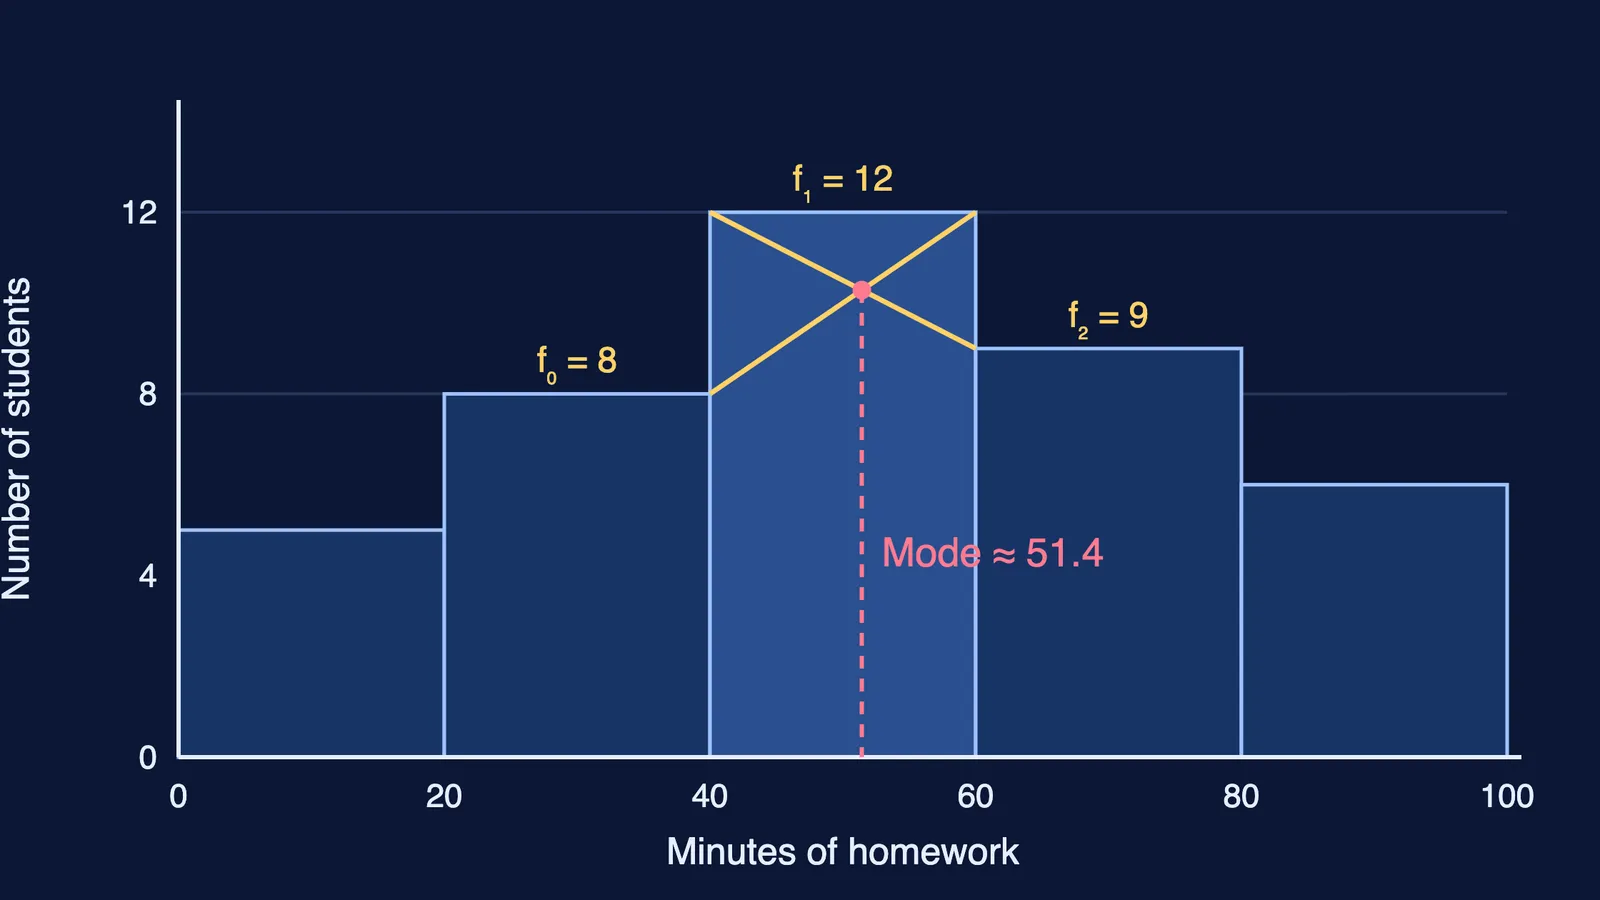
The modal class is the class with the highest frequency. The mode is a value inside it:
Mode = l + [(f₁ − f₀) / (2f₁ − f₀ − f₂)] × h
l = lower limit of the modal class, h = class size
f₁ = frequency of the modal class, f₀ = frequency of the class before it, f₂ = frequency of the class after it
Conditions: classes must be continuous and of equal size, and there must be a single modal class (CBSE asks you to avoid bimodal data).
Worked example: the modal class is 40-60 (frequency 12). So l = 40, f₁ = 12, f₀ = 8, f₂ = 9 and h = 20. Mode = 40 + [4 / (24 − 8 − 9)] × 20 = 40 + 80/7 ≈ 51.43 minutes.
Watch for: the denominator is 2f₁ − f₀ − f₂. Writing 2f₁ − f₀ + f₂ is a sign slip that changes the answer.
What is the median formula for grouped data?
First find n/2. The median class is the first class whose cumulative frequency is greater than (and nearest to) n/2.
Median = l + [(n/2 − cf) / f] × h
l = lower limit of the median class, n = number of observations
cf = cumulative frequency of the class before the median class, f = frequency of the median class, h = class size
Conditions: continuous classes of equal size.
Empirical relationship: 3 Median = Mode + 2 Mean. It is an approximate link between the three measures, not an exact identity.
Worked example: n/2 = 20. The cumulative frequencies are 5, 13, 25, so 40-60 is the median class. With l = 40, cf = 13, f = 12 and h = 20: Median = 40 + [(20 − 13)/12] × 20 = 40 + 140/12 ≈ 51.67 minutes. The empirical relation then estimates Mode ≈ 3 × (155/3) − 2 × 51.5 = 155 − 103 = 52, close to the formula's 51.43.
Watch for: cf is the cumulative frequency of the class before the median class (13), not of the median class itself (25).
How to revise this formula sheet
Rework the homework table above from a blank page: mean by all three methods, then mode and median. Three different means point to a slip in the dᵢ or uᵢ column.
Write a one-line definition of l, h, f₀, f₁, f₂, cf and f from memory. Then check them against the lists above.
Practise one "less than" cumulative table: turn it back into class frequencies by subtracting neighbours, then find the median.
Check each answer for sense: the mode must lie inside the modal class and the median inside the median class.
If you get stuck on why a step works, the Fermi Problem Library has worked problems with a step-by-step solver that explains the reasoning rather than printing an answer. The next chapter's ideas are in our Probability Class 10 guide, and the Class 11 follow-up, variance and standard deviation, is in Statistics Class 11 Maths.